- 文章信息
- 作者: kaiwu
- 点击数:707
- Cite a dataset produced by the COVID-NMA initiative by using this format:
Thu Van Nguyen, Gabriel Ferrand, Sarah Cohen-Boulakia, Ruben Martinez, Philipp Kapp, Emmanuel Coquery, … for the COVID-NMA consortium. (2020). RCT studies on preventive measures and treatments for COVID-19 [Data set]. Zenodo. http://doi.org/10.5281/zenodo.4266528 - Cite a visualization developed by the COVID-NMA initiative by using this format:
Data: Thu Van Nguyen, Gabriel Ferrand, Sarah Cohen-Boulakia, Ruben Martinez, Philipp Kapp, Emmanuel Coquery, … for the COVID-NMA consortium. (2020). RCT studies on preventive measures and treatments for COVID-19 [Data set]. Zenodo. http://doi.org/10.5281/zenodo.4266528
Visualizations: Romain Vuillemot - LIRIS, École Centrale de Lyon; Philippe Rivière - LIRIS, VisionsCarto; Pierre Ripoll - LIRIS, INSA Lyon; Julien Barnier - Centre Max Weber, CNRS.
Retrieved from: ‘https://covid-nma.com/dataviz/’ [Online Resource]
https://covid-nma.com/dataviz/
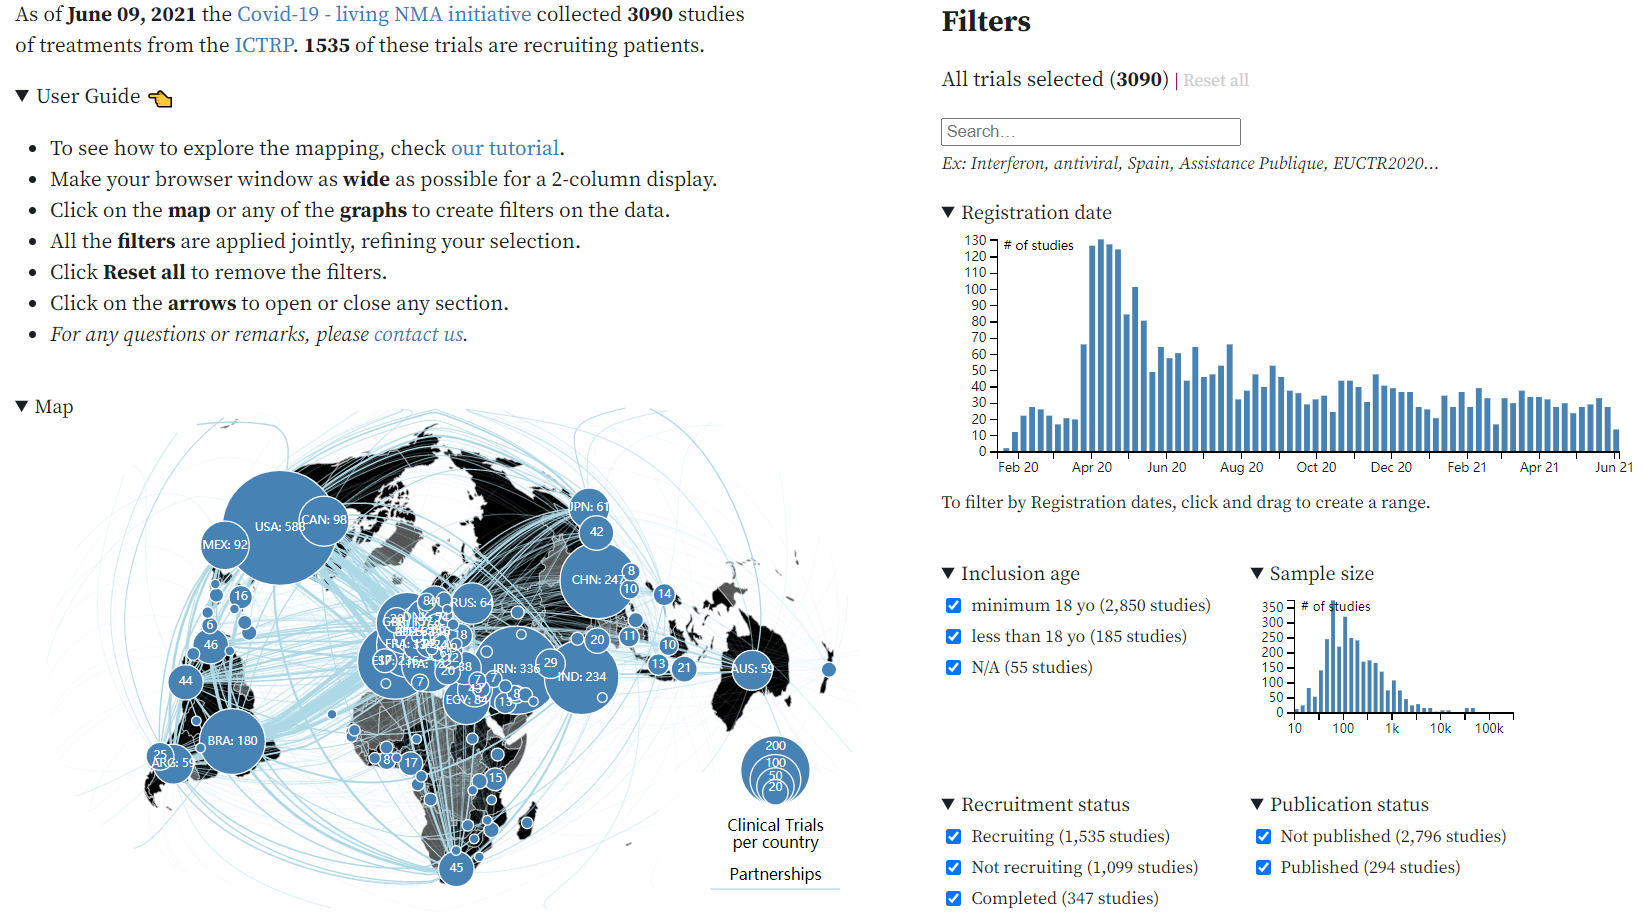
https://covid-nma.com/vaccines/mapping/
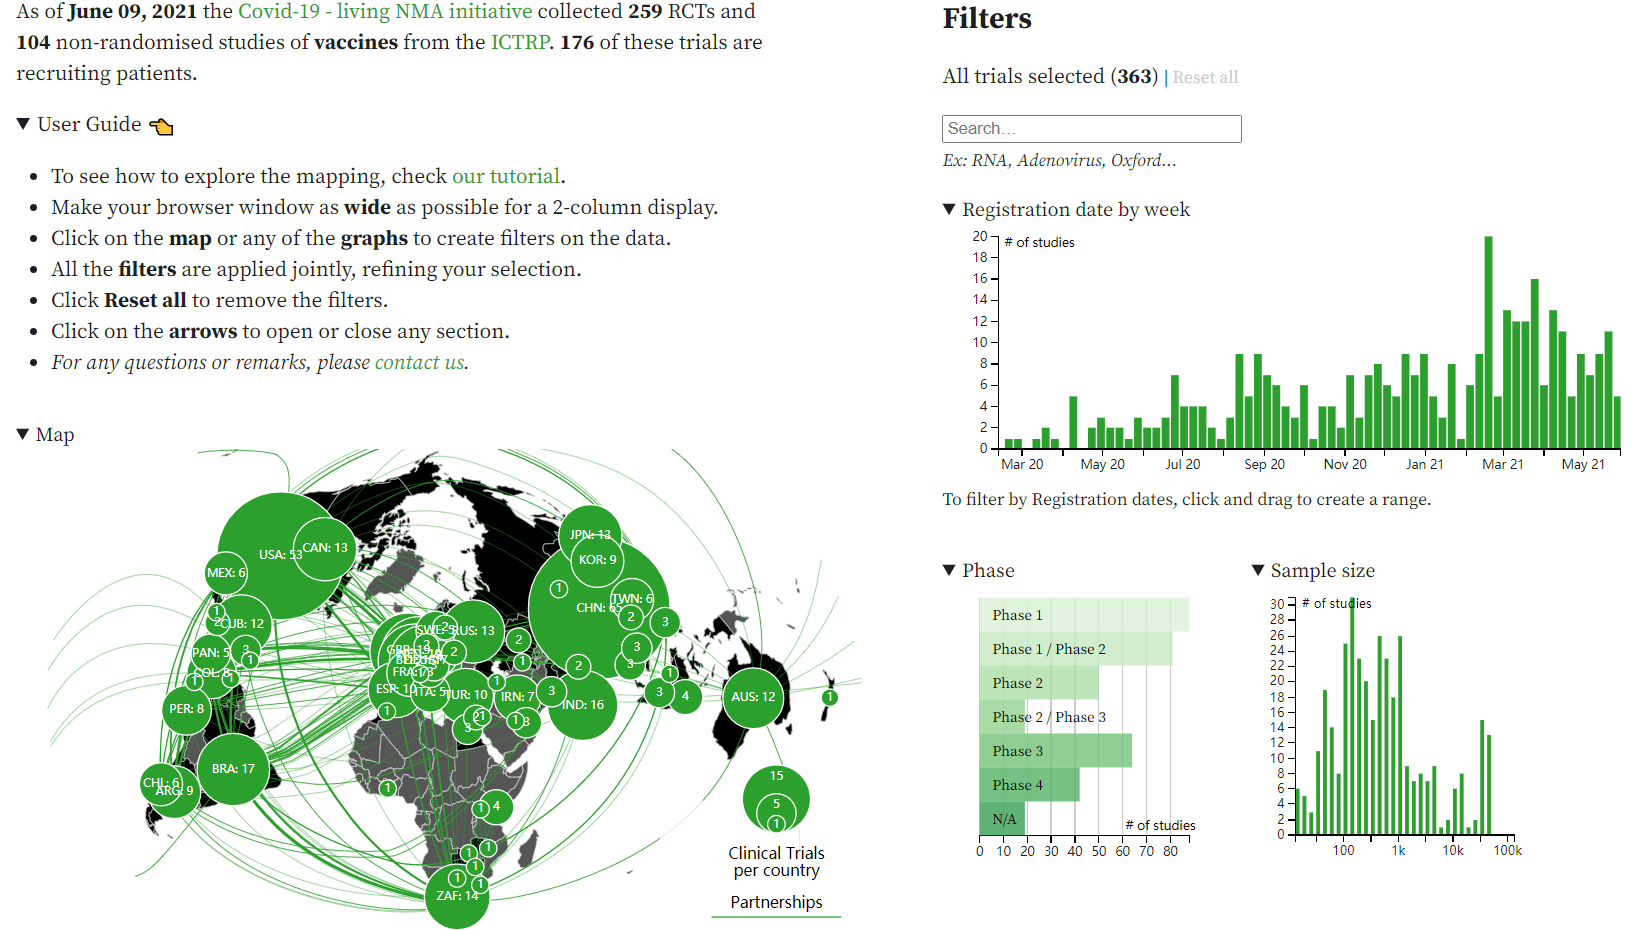
https://covid-nma.com/treatments_tested/
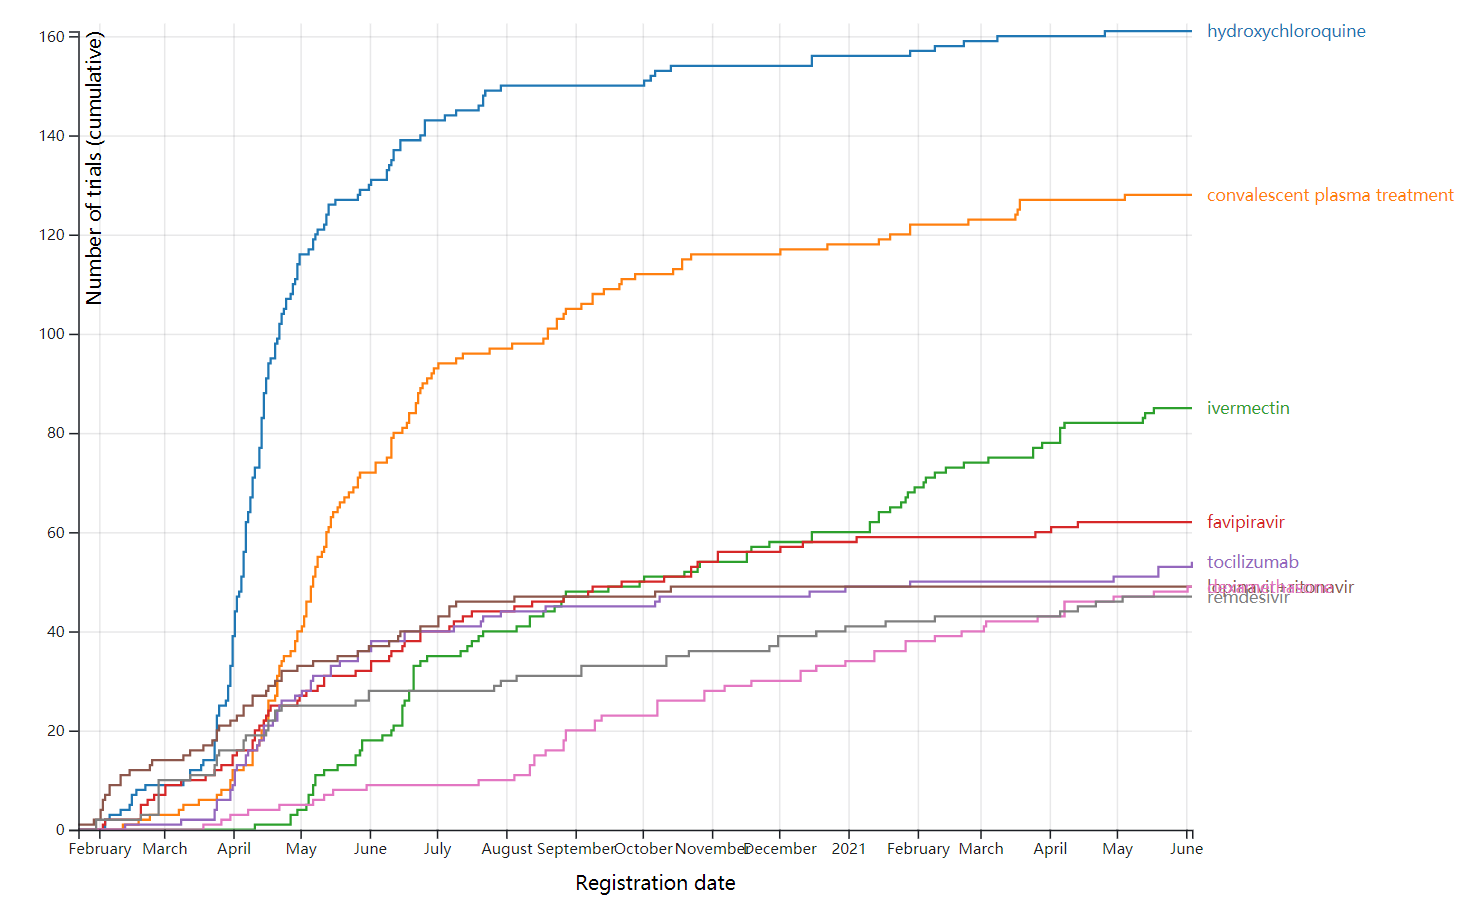
https://ncov.dxy.cn/ncovh5/view/pneumonia?from=timeline
https://www.healthmap.org/covid-19/
https://who.maps.arcgis.com/apps/opsdashboard/index.html#/c88e37cfc43b4ed3baf977d77e4a0667
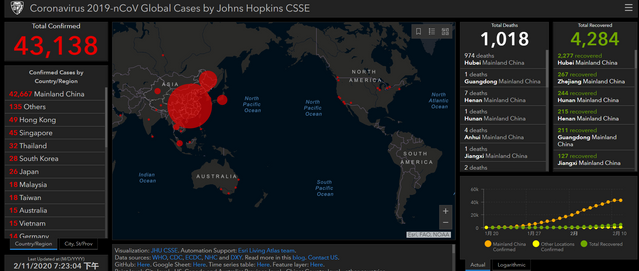
1.Johns Hopkins University
Johns Hopkins University
The Center for Systems Science and Engineering (CSSE) at Johns Hopkins University(JHU)
Visualization:JHU CSSE.
Automation Support:Esri Living Atlas team.
Read more in thisblog.
Data sources:WHO,CDC,ECDC, NHC andDXY.
Downloadable Google Sheet (new link):Here. Time series table:Here. Feature service:Here.
Point level: City level - US, Canada and Australia; Province level - China; Country level - other countries.
maps
https://gisanddata.maps.arcgis.com/apps/opsdashboard/index.html#/bda7594740fd40299423467b48e9ecf6
http://www.arcgis.com/apps/opsdashboard/index.html#/85320e2ea5424dfaaa75ae62e5c06e61
https://systems.jhu.edu/research/public-health/ncov-model-2/
2.Git hub
https://github.com/CSSEGISandData/COVID-19
https://github.com/search?q=ncov+2019(715)
https://github.com/shfshanyue/2019-ncov
https://github.com/BlankerL/DXY-COVID-19-Crawler
3.kaggle
The goal of this page is to bring together the most useful contributions from the Kaggle community's COVID-19 work into a single place. It is organized into literature review, tools and datasets.
https://www.kaggle.com/allen-institute-for-ai/CORD-19-research-challenge
https://www.kaggle.com/covid-19-contributions
https://www.kaggle.com/search?q=2019+ncov(257)
https://www.kaggle.com/paultimothymooney/coronavirus-genome-sequence/discussion/132982#latest-759834
https://www.kaggle.com/sudalairajkumar/novel-corona-virus-2019-dataset
4.tableau
https://public.tableau.com/zh-cn/search/all/ncov(161)
https://public.tableau.com/profile/dennis199441#!/vizhome/2019-nCoVMap/2019-nCoVMap
5.mathematica
https://community.wolfram.com/groups/-/m/t/1872608?source=frontpage-latest-news
- 文章信息
- 作者: kaiwu
- 点击数:1189
Lingo是Linear Interaction and General Optimizer的缩写,中文名称为“交互式线性和通用优化求解器”,是由美国LINDO公司(1979年创立,总部位于美国芝加哥市)开发的一套运筹学(管理科学)软件包。Lingo可用于求解线性规划、二次规划、整数规划、非线性规划等问题。

官方网站:https://www.lindo.com/index.php/products/lingo-and-optimization-modeling
中文网站:http://www.lindochina.com/lg01.html
试用版下载网址:https://www.lindo.com/index.php/ls-downloads/try-lingo
最新版本:19.0
软件大小:40.3兆
教育版价格表:https://www.lindo.com/prices/EduPrices.pdf
商业版价格表:https://www.lindo.com/prices/CommercialPrices.pdf
公司发展历史:https://www.lindo.com/index.php/company/the-lindo-story
官方推荐书籍列表:https://www.lindo.com/index.php/help/recommended-books
|
1.Lindo System Inc. (2020). Lingo: The Modeling Language & Optimizer. Chicago, Illinois: Lindo System Inc.
http://www.lindochina.com/pic/PDF/LINGO.pdf
2.Schrage, L. (2006). Optimization Modeling with LINGO (6th). Chicago, Illinois: Lindo System Inc.
http://www.lindochina.com/pic/PDF/Optimization%20Modeling%20with%20LINGO%20by%20Linus%20Schrage.pdf
 http://www.lindochina.com/xzzx04.html
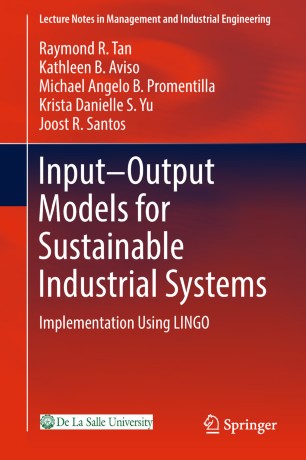
3.Tan, R. R., Aviso, K. B., Promentilla, M. A. B., Yu, K. D. S., & Santos, J. R. (2019). Input-Output Models for Sustainable Industrial Systems: Implementation Using LINGO. Singapore: Springer.
http://link.springer.com/10.1007/978-981-13-1873-3
4.Winston, W. L., & Goldberg, J. B. (2004). Operations Research: Applications and Algorithms (4th). Belmont, CA: Thomson Brooks.
https://www.amazon.com/dp/0534380581

温斯顿. (2004). 运筹学: 数学规划(英文影印版). 清华大学出版社.
https://book.douban.com/subject/1230287/
5.袁新生. (2007). LINGO和Excel在数学建模中的应用. 科学.
https://book.douban.com/subject/2023597/

6.谢金星, & 薛毅. (2005). 优化建模与LINDO/LINGO软件. 清华大学出版社.
https://book.douban.com/subject/1420357/

- 文章信息
- 作者: kaiwu
- 点击数:884

官网下载:https://cran.r-project.org/
图形界面Rstudio: https://www.rstudio.com/
维基百科:https://en.wikipedia.org/wiki/R_(programming_language)(programming_language)
R Journal:https://journal.r-project.org/
R Manuals:https://cran.r-project.org/manuals.html
R Packages: https://cran.r-project.org/web/packages/index.html
Microsoft R Application Network: https://mran.microsoft.com/
R for excel
https://www.rforexcelusers.com/
Quick-R
R bloggers
Data Science Made simple
http://www.datasciencemadesimple.com/learn-r-what-is-r/
Database using R
Data Camp
Try R
Journal of Statistical Software
https://www.jstatsoft.org/index
Wickham, H., & Grolemund, G. (2017). R for Data Science: Import, Tidy, Transform, Visualize, and Model Data. Sebastopol, CA: O’Reilly Media.

The easiest place to start when turning an exploratory graphic into an expository graphic is with good labels. You add labels with the labs() function. This example adds a plot title:
ggplot(mpg, aes(displ, hwy)) +
  geom_point(aes(color = class)) +
  geom_smooth(se = FALSE) +
  labs(title = "Fuel efficiency generally decreases with engine size")

Histogram and density plots
The histogram and density plots are used to display the distribution of data.
# Histogram  plot
# Change histogram fill color by group (sex)
qplot(weight, data = wdata, geom = "histogram",
      fill = sex)
# Density plot
# Change density plot line color by group (sex)
# change line type
qplot(weight, data = wdata, geom = "density",
    color = sex, linetype = sex)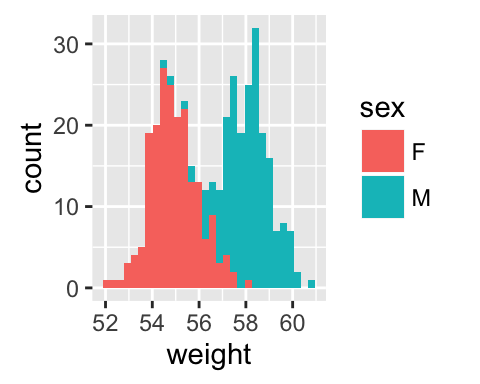

- 文章信息
- 作者: kaiwu
- 点击数:667
Max Roser (2019) - "Tourism". Published online at OurWorldInData.org. Retrieved from: 'https://ourworldindata.org/tourism' [Online Resource]
The map shows the number of tourists by country. France is today the country that receives most tourists.
- 文章信息
- 作者: kaiwu
- 点击数:939
1.Evernote(印象笔记)
evernote:https://evernote.com
印象笔记:https://www.yinxiang.com/
Evernote作为云笔记的典型代表,其功能和潜力远远超出设计者的设想,Evernote在国内的服务称为“印象笔记”,Evernote和印象笔记除了服务器的存储位置不同,功能大体一致,但是帐号不是共用的,一定要注意访问的网站。

evernote功能介绍
http://v.youku.com/v_show/id_XODU2NTk0NjU2.html?from=s1.8-1-1.2&spm=a2h0k.8191407.0.0
evernote(印象笔记)官方使用指南
https://www.yinxiang.com/evernote/guide/windows
百度经验上关于evernote(印象笔记)的使用方法
(1)基本操作
(2)群聊功能
(3)其它功能

2.微软的onenote
界面很有特点,功能完善。

3.谷歌的google keep

4.讯飞语记
http://www.iyuji.cn/iyuji/index
http://www.iyuji.cn/iyuji/home

讯飞公司以语音识别见长。麻省理工技术评论杂志(MIT Technology Review)推出了一个智能企业排名2017(50 Smartest Companies 2017),讯飞公司排到了第6名。
50 smartest companies 2017 from MIT technology review
4.有道云笔记
国内用户很多的云笔记,网易公司旗下产品

5.和笔记
中国移动公司产品,此前有过彩云笔记(logo是粉色背景)的名字。

此外,腾讯微云(https://www.weiyun.com/),还有很多在线office平台也提供了云笔记服务。
6.思维笔记
![]()
字节跳动公司提供的服务
https://docs.feishu.cn/mindnotes
7.Joplin Note

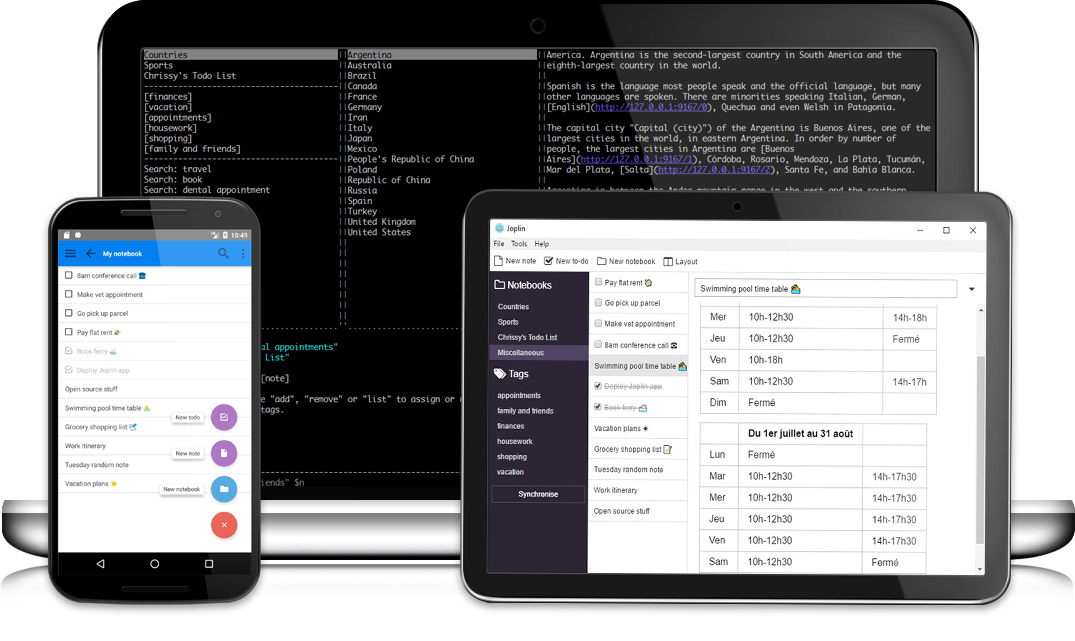
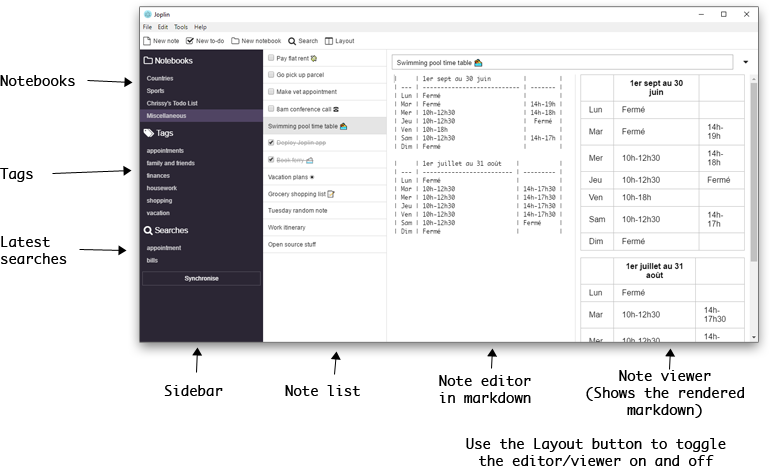
Joplin是一个开源(open source)的云笔记和日程管理工具;提供了windows、mac、linux的桌面程序,也提供了移动应用;可以通过一些网盘(onedrive,dropbox,nextcloud,AWS S3)或其它支持webdav服务的网盘进行云同步;完全支持markdown,(顺便说一句,evernote也开始支持markdown了,但是桌面程序可以编辑markdown,手机等移动应用只能查看、无法编辑markdown笔记)。
2018年受欢迎的云笔记工具(国外)

