
- Cite a dataset produced by the COVID-NMA initiative by using this format:
Thu Van Nguyen, Gabriel Ferrand, Sarah Cohen-Boulakia, Ruben Martinez, Philipp Kapp, Emmanuel Coquery, … for the COVID-NMA consortium. (2020). RCT studies on preventive measures and treatments for COVID-19 [Data set]. Zenodo. http://doi.org/10.5281/zenodo.4266528 - Cite a visualization developed by the COVID-NMA initiative by using this format:
Data: Thu Van Nguyen, Gabriel Ferrand, Sarah Cohen-Boulakia, Ruben Martinez, Philipp Kapp, Emmanuel Coquery, … for the COVID-NMA consortium. (2020). RCT studies on preventive measures and treatments for COVID-19 [Data set]. Zenodo. http://doi.org/10.5281/zenodo.4266528
Visualizations: Romain Vuillemot - LIRIS, École Centrale de Lyon; Philippe Rivière - LIRIS, VisionsCarto; Pierre Ripoll - LIRIS, INSA Lyon; Julien Barnier - Centre Max Weber, CNRS.
Retrieved from: ‘https://covid-nma.com/dataviz/’ [Online Resource]
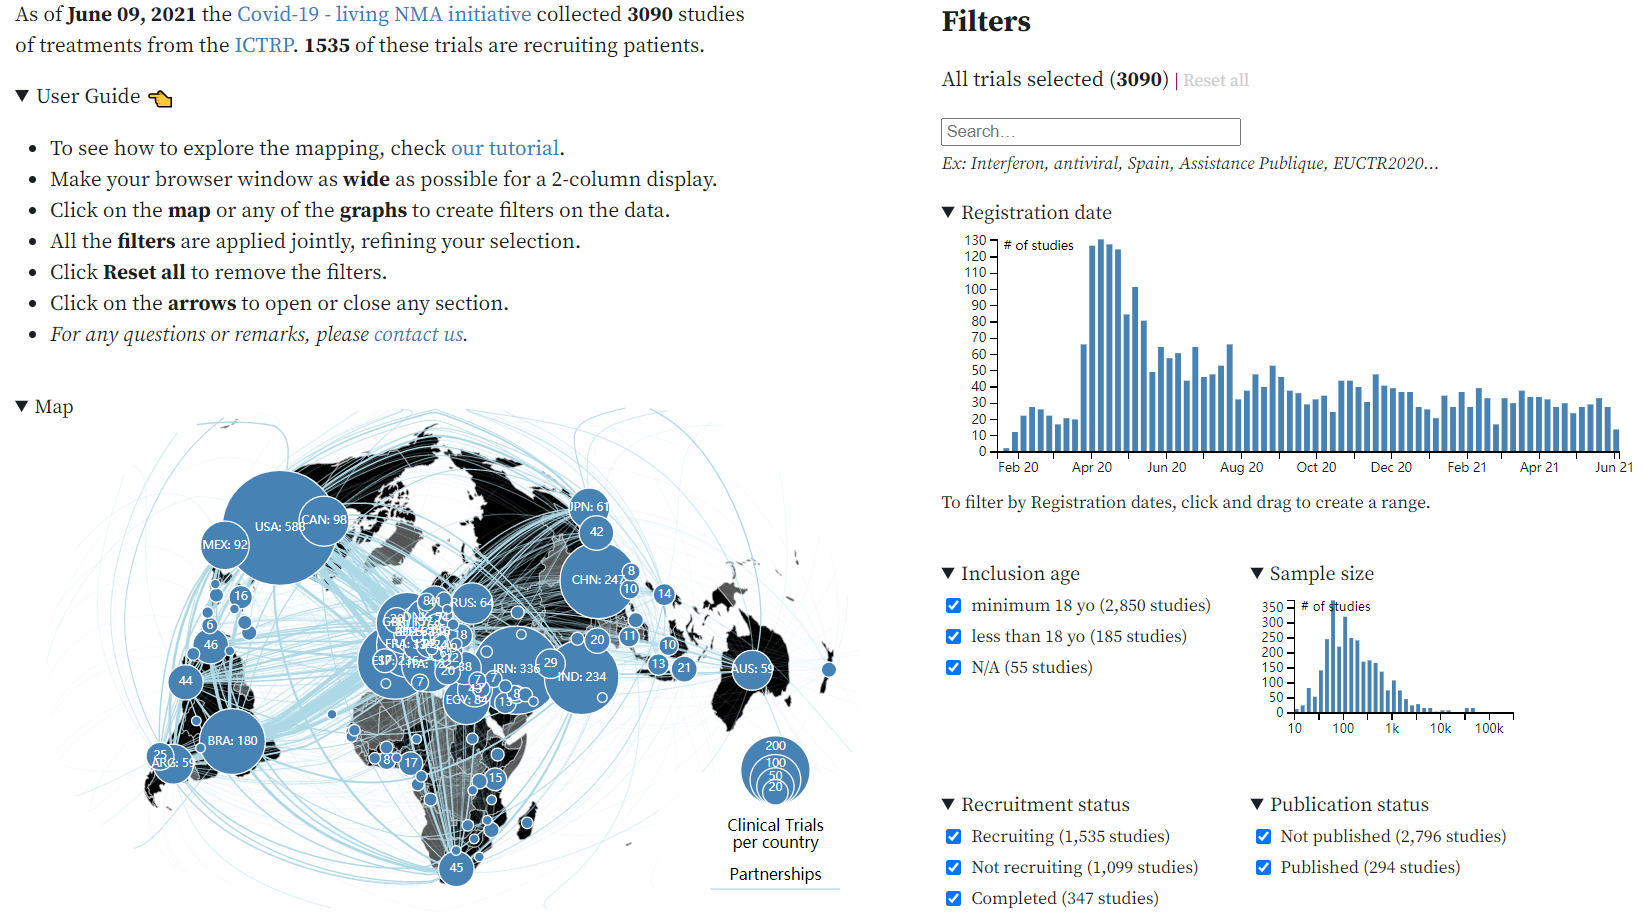
https://covid-nma.com/dataviz/
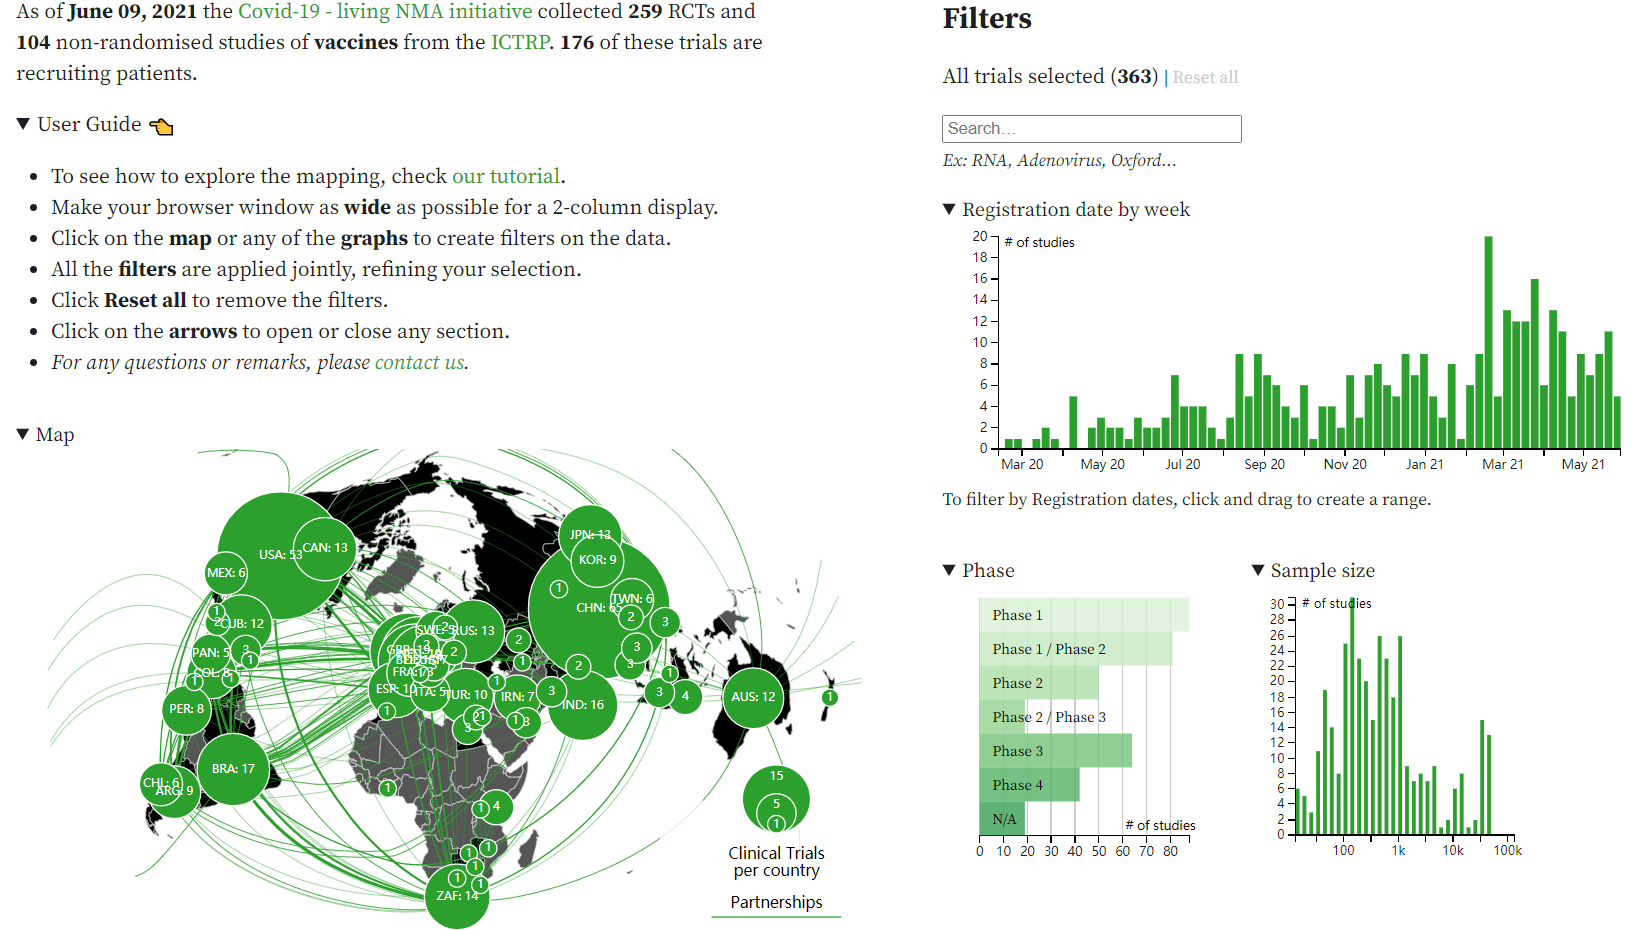
https://covid-nma.com/vaccines/mapping/
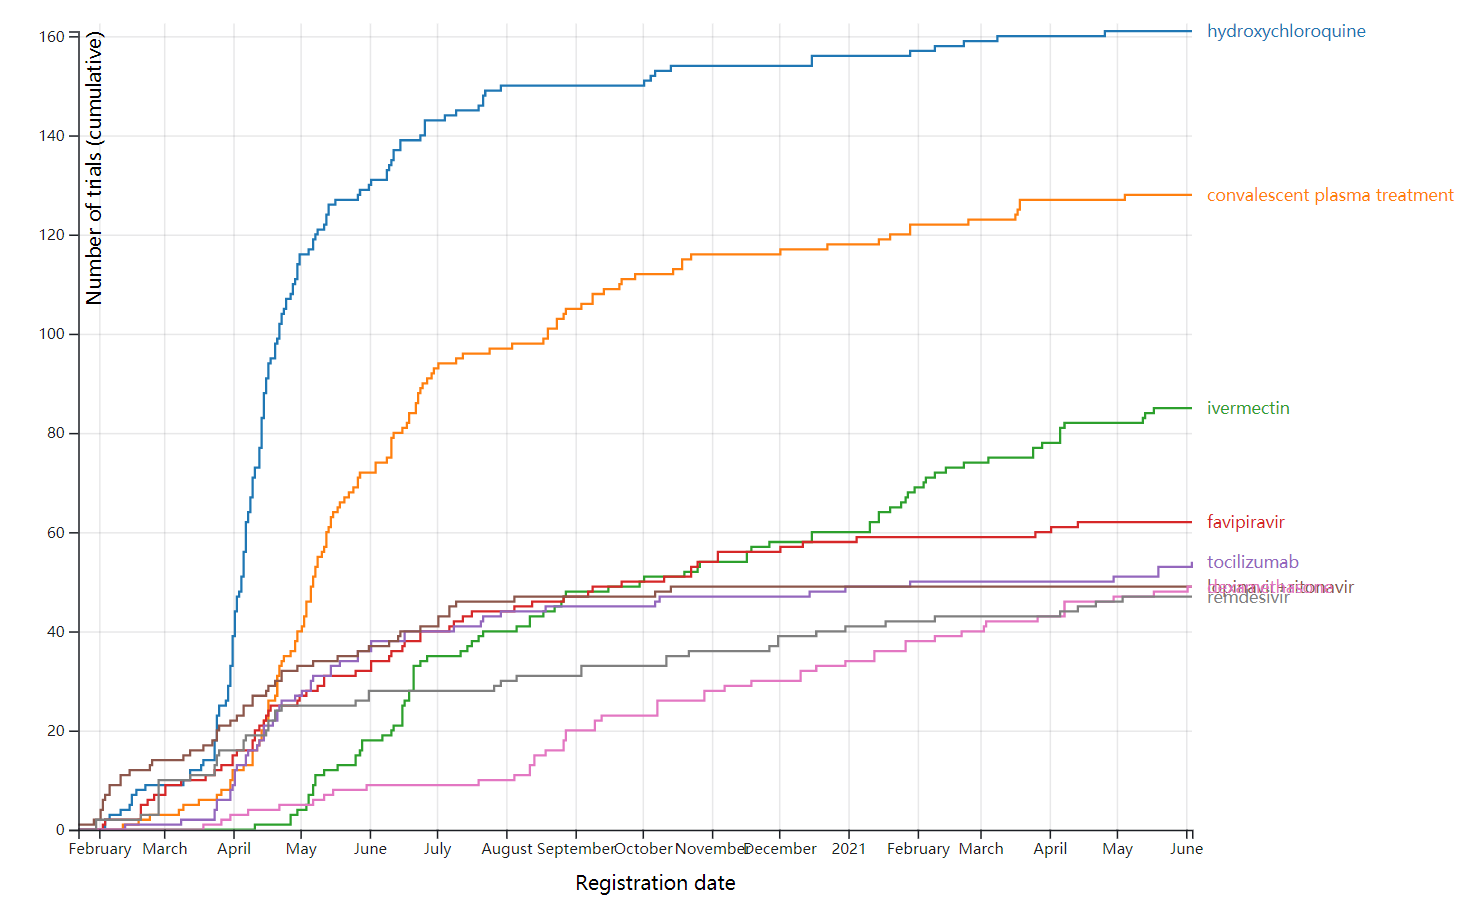
https://covid-nma.com/treatments_tested/
https://ncov.dxy.cn/ncovh5/view/pneumonia?from=timeline
https://www.healthmap.org/covid-19/
https://who.maps.arcgis.com/apps/opsdashboard/index.html#/c88e37cfc43b4ed3baf977d77e4a0667
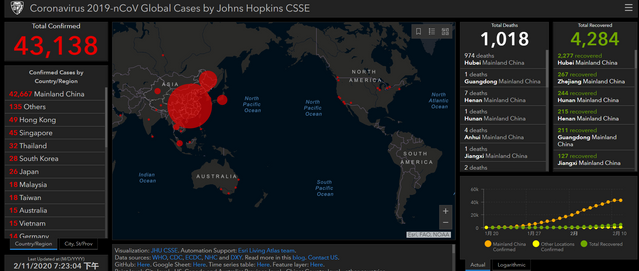
1.Johns Hopkins University
Johns Hopkins University
The Center for Systems Science and Engineering (CSSE) at Johns Hopkins University(JHU)
Visualization:JHU CSSE.
Automation Support:Esri Living Atlas team.
Read more in thisblog.
Data sources:WHO,CDC,ECDC, NHC andDXY.
Downloadable Google Sheet (new link):Here. Time series table:Here. Feature service:Here.
Point level: City level - US, Canada and Australia; Province level - China; Country level - other countries.
maps
https://gisanddata.maps.arcgis.com/apps/opsdashboard/index.html#/bda7594740fd40299423467b48e9ecf6
http://www.arcgis.com/apps/opsdashboard/index.html#/85320e2ea5424dfaaa75ae62e5c06e61
https://systems.jhu.edu/research/public-health/ncov-model-2/
2.Git hub
https://github.com/CSSEGISandData/COVID-19
https://github.com/search?q=ncov+2019(715)
https://github.com/shfshanyue/2019-ncov
https://github.com/BlankerL/DXY-COVID-19-Crawler
3.kaggle
The goal of this page is to bring together the most useful contributions from the Kaggle community's COVID-19 work into a single place. It is organized into literature review, tools and datasets.
https://www.kaggle.com/allen-institute-for-ai/CORD-19-research-challenge
https://www.kaggle.com/covid-19-contributions
https://www.kaggle.com/search?q=2019+ncov(257)
https://www.kaggle.com/paultimothymooney/coronavirus-genome-sequence/discussion/132982#latest-759834
https://www.kaggle.com/sudalairajkumar/novel-corona-virus-2019-dataset
4.tableau
https://public.tableau.com/zh-cn/search/all/ncov(161)
https://public.tableau.com/profile/dennis199441#!/vizhome/2019-nCoVMap/2019-nCoVMap
5.mathematica
https://community.wolfram.com/groups/-/m/t/1872608?source=frontpage-latest-news