
- 文章信息
- 作者: kaiwu
- 点击数:930
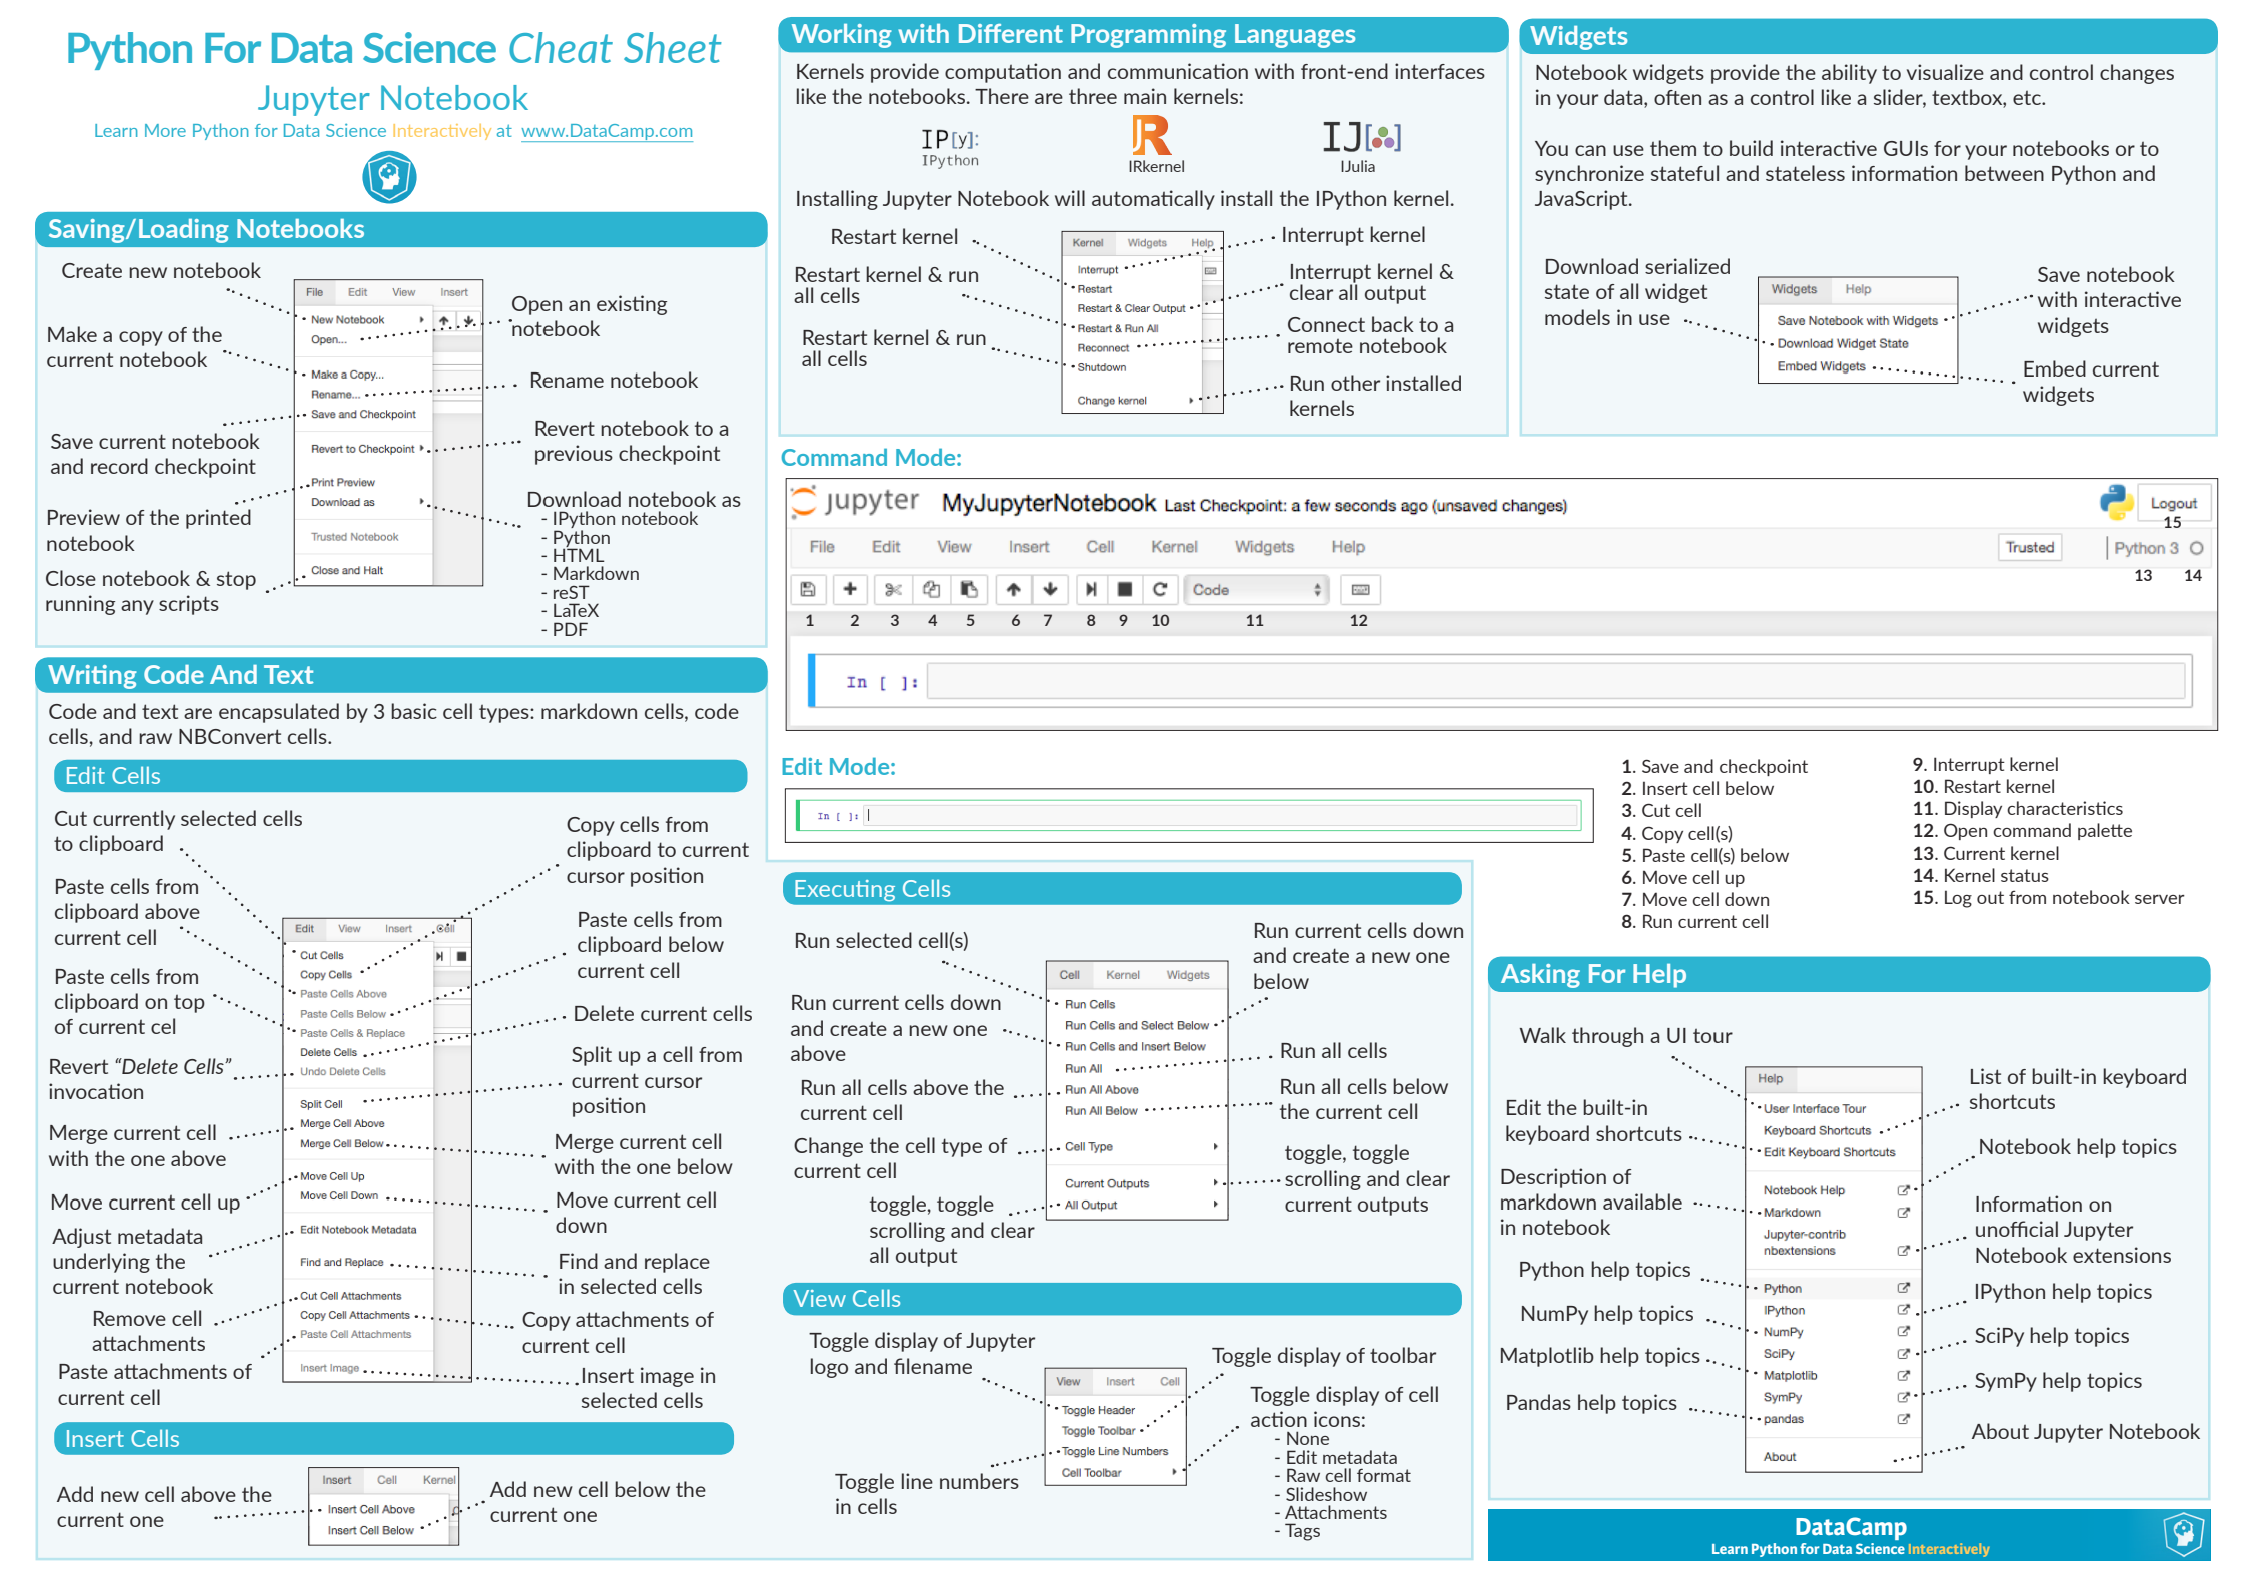
https://github.com/profandyfield

Webcasts
For your visual delectation several webcasts are available that contain material relevant to the book. Most of these are actual lectures given by Andy Field, which cover the theory of some of the tests in the book. Enjoy …!
These files are hosted on Andy Field’s YouTube channel, www.youtube.com/user/ProfAndyField and can therefore be viewed on any platform with any web browser. All you need is an internet connection. The contents of the website and webcasts have been prepared by Andy Field entirely and not SAGE Publications and does contain language and other content that some people may find offensive.
Tip: Click on each link to expand and view the content. Click again to collapse.
Chapter 1: Why is my evil lecturer forcing me to learn statistics?
Chapter 2: Everything you ever wanted to know about statistics (well, sort of)
Chapter 5: Exploring assumptions
Chapter 7: Regression
Chapter 10: Comparing several means: ANOVA (GLM 1)
discovrTo use discovr you first need to install ![]() and
and ![]() and familiarise yourself with
and familiarise yourself with ![]() ,
, ![]() and good workflow practice. You can do this using this interactive tutorial. Once you have installed
and good workflow practice. You can do this using this interactive tutorial. Once you have installed ![]() and
and ![]() you can install
you can install discovr. The package is in development so you have to install it from github. To install the package execute (in ![]() ):
):
if(!require(remotes)){
  install.packages('remotes')
}

remotes::install_github("profandyfield/discovr")
If you are trying to install on a networked computer the install might fail (it’s to do install.packages not liking UNC paths, which I’m not even going to pretend to understand). The solution is to specify the location of your ![]() library at the point of install. Most networks will map network locations to a drive name (for example, at my own University, users accounts are on the ‘N’ drive). Find the location of your
library at the point of install. Most networks will map network locations to a drive name (for example, at my own University, users accounts are on the ‘N’ drive). Find the location of your ![]() library (e.g.,
library (e.g., N:/Documents/R/win-library/3.5), possibly executing .libPaths() to help you, and specify this location using the lib argument:
remotes::install_github("profandyfield/discovr", lib = "N:/Documents/R/win-library/3.5")
Interactive tutorials
I recommend working through this tutorial on how to install, set up and work within ![]() and
and ![]() before starting the interactive tutorials.
before starting the interactive tutorials.
List of tutorials
- discovr_01: Key concepts in
 (functions and objects, packages and functions, style, data types, tidyverse, tibbles)
 - discovr_02: Summarizing data (frequency distributions, grouped frequency distributions, relative frequencies, histograms, mean, median, variance, standard deviation, interquartile range)
- discovr_03: Confidence intervals: interactive app demonstrating what a confidence interval is, computing normal and bootstrap confidence intervals using , adding confidence intervals to data summaries.
- discovr_05: Visualizing data. The ggplot2 package, boxplots, plotting means, violin plots, scatterplots, grouping by colour, grouping using facets, adjusting scales, adjusting positions."
- discovr_06: The beast of bias. Restructuring data from messy to tidy format (and back). Spotting outliers using histograms and boxplots. Calculating z-scores (standardizing scores). Writing your own function. Using z-scores to detect outliers. Q-Q plots. Calculating skewness, kurtosis and the number of valid cases. Grouping summary statistics by multiple categorical/grouping variables.
- discovr_07: Associations. Plotting data with GGally. Pearson’s r, Spearman’s Rho, Kendall’s tau, robust correlations.
- discovr_08: The general linear model (GLM). Visualizing the data, fitting GLMs with one and two predictors. Viewing model parameters with broom, model parameters, standard errors, confidence intervals, fit statistics, significance, Bayes factors and Bayesian estimates (using default priors).
- discovr_09: Categorical predictors with two categories (comparing two means). Comparing two independent means, comparing two related means, effect sizes, robust comparisons of means (independent and related), Bayes factors and estimation (independent and related means).
- discovr_10: Moderation and mediation. Centring variables (grand mean centring), specifying interaction terms, moderation analysis, simple slopes analysis, Johnson-Neyman intervals, mediation with one predictor, direct and indirect effects, mediation using
lavaan. - discovr_11: Comparing several means. Essentially ‘One-way independent ANOVA’ but taught using a general linear model framework. Covers setting contrasts (dummy coding, contrast coding, and linear and quadratic trends), the F-statistic and Welch’s robust F, robust parameter estimation, heteroscedasticity-consistent tests of parameters, robust tests of means based on trimmed data, post hoc tests, Bayes factors.
- discovr_12: Comparing means adjusted for other variables. Essentially ‘Analysis of Covariance (ANCOVA)’ designs but taught using a general linear model framework. Covers setting contrasts, Type III sums of squares, the F-statistic, robust parameter estimation, heteroscedasticity-consistent tests of parameters, robust tests of adjusted means, post hoc tests, Bayes factors.
- discovr_13: Factorial designs. Fitting models for two-way factorial designs (independent measures) using both
lm()and theafexpackage. This tutorial builds on previous ones to show how models can be fit with two categorical predictors to look at the interaction between them. We look at fitting the models, setting contrasts for the two categorical predictors, obtaining estimated marginal means, interaction plots, simple effects analysis, diagnostic plots, partial eta-squared and partial omega-squared, robust models and Bayes factors. - discovr_14: Multilevel models.
- discovr_15: Repeated measures designs. Fitting models for one- and two-way repeated measures designs using the
afexpackage. This tutorial builds on previous ones to show how models can be fit with one or two categorical predictors when these variables have been manipulated within the same entities. We look at fitting the models, setting contrasts for the categorical predictors, obtaining estimated marginal means, interaction plots, simple effects analysis, diagnostic plots, robust models and Bayes factors. - discovr_16: Mixed designs. Fitting models for mixed designs using the
afexpackage. This tutorial builds on previous ones to show how models can be fit with one or two categorical predictors when at least one of these variables has been manipulated within the same entities and at least one other has been manipulated using different entities. We look at fitting the models, setting contrasts for the categorical predictors, obtaining estimated marginal means, interaction plots, simple effects analysis, diagnostic plots, robust models and Bayes factors. - discovr_18: Exploratory Factor Analysis (EFA). Applying factor analysis using the
psychpackage. This tutorial uses a fictitious questionnaire (the Anxiety Scale, RAQ) with 23 items to show how EFA can be used to identify clusters of items that may, or may not, represent constructs associated with anxiety about using . We look at inspecting the correlation matrix, obtaining the Bartlett test and KMO statistics, using parallel analysis to determine the number of factors to extract, extracting factors, rotating the solution nd interpretation of the factors. We also learn to obtain Cronbach’s alpha on each of the subscales.
- 文章信息
- 作者: kaiwu
- 点击数:815
经典教材:爱上统计学Statistics for People Who (think They) Hate Statistics
作者:Neil J. Salkind(1947-2017)
https://www.findagrave.com/memorial/192090437/neil-j-salkind
https://www.socialsciencespace.com/2017/11/gentle-guide-neil-salkind-1947-2017/

The gentle good humor of that answer imbues one of his enduring efforts for SAGE Publishing, the Statistics for People Who (Think They) Hate Statistics books.
“Neil Salkind’s statistics textbooks were so successful because Neil had a unique gift for communicating an often-intimidating subject in a playful and humorous way,” recalled Helen Salmon, a senior acquisitions editor with SAGE. “His bestselling Statistics for People Who (Think They) Hate Statistics put students at ease, without being condescending. Neil was incredibly generous with his time and expertise: he published his email address in the front of his books, and would respond to several emails a day from students from around the world who asked for his advice and help. He was a wonderful author to work with, as he was always dreaming up the next project.”
https://uk.sagepub.com/en-gb/asi/author/neil-joseph-salkind
https://www.amazon.com/Neil-J.-Salkind/e/B000APV1GM
https://www.goodreads.com/author/show/8442.Neil_J_Salkind
Chapter 16: Two Groups Too Many Factors
Import our first data set
ch16ds1<-read.csv('D:/kaiwu_study/study2022love_statistics/16/ch16ds1.csv',header=TRUE,encoding = 'UTF-8')View what we just imported. Did we get what we expected?
head(ch16ds1)Get descriptive statistics about each group
Load the psych library
library(psych)
library(dplyr)
##
## 载入程辑包:'dplyr'## The following objects are masked from 'package:stats':
##
## filter, lag## The following objects are masked from 'package:base':
##
## intersect, setdiff, setequal, unionlibrary(ggplot2)##
## 载入程辑包:'ggplot2'## The following objects are masked from 'package:psych':
##
## %+%, alphalibrary(car)## 载入需要的程辑包:carData##
## 载入程辑包:'car'## The following object is masked from 'package:dplyr':
##
## recode## The following object is masked from 'package:psych':
##
## logitUse the function
summary(ch16ds1)## Treatment Gender Loss
## Length:40 Length:40 Min. :54.00
## Class :character Class :character 1st Qu.:65.00
## Mode :character Mode :character Median :76.00
## Mean :73.97
## 3rd Qu.:78.25
## Max. :98.00describeBy(ch16ds1$Loss, group = list(ch16ds1$Treatment,
ch16ds1$Gender))##
## Descriptive statistics by group
## : High Impact
## : Female
## vars n mean sd median trimmed mad min max range skew kurtosis se
## X1 1 10 79.4 11.89 84.5 79.88 8.15 65 90 25 -0.23 -2 3.76
## ------------------------------------------------------------
## : Low Impact
## : Female
## vars n mean sd median trimmed mad min max range skew kurtosis se
## X1 1 10 64 11.23 60.5 62.38 9.64 54 87 33 0.81 -0.8 3.55
## ------------------------------------------------------------
## : High Impact
## : Male
## vars n mean sd median trimmed mad min max range skew kurtosis se
## X1 1 10 73.7 6.67 76 75.5 0 55 78 23 -2.15 3.21 2.11
## ------------------------------------------------------------
## : Low Impact
## : Male
## vars n mean sd median trimmed mad min max range skew kurtosis se
## X1 1 10 78.8 11.04 76 79.25 1.48 56 98 42 -0.25 -0.17 3.49ch16ds1sumary<- ch16ds1 %>%
group_by(Treatment, Gender) %>%
summarize(n = n(),
mean = mean(Loss),
sd = sd(Loss),
ci = qt(0.975, df = n - 1)* sd /sqrt(n))## `summarise()` has grouped output by 'Treatment'. You can override using the
## `.groups` argument.ch16ds1sumaryRun the ANOVA
# Check the default contrasts used by aov
options("contrasts")
## $contrasts
## unordered ordered
## "contr.treatment" "contr.poly"# Change the default for categorical variables
options(contrasts = c("contr.helmert", "contr.poly"))
# Check the contrasts again to make sure it worked
options("contrasts")## $contrasts
## [1] "contr.helmert" "contr.poly"Calculate your ANOVA
m1 <- aov(Loss ~ Treatment + Gender + Treatment*Gender, data = ch16ds1)Look at the results from the ANOVA
summary(m1)## Df Sum Sq Mean Sq F value Pr(>F)
## Treatment 1 265 265.2 2.444 0.12669
## Gender 1 207 207.0 1.908 0.17570
## Treatment:Gender 1 1051 1050.6 9.683 0.00363 **
## Residuals 36 3906 108.5
## ---
## Signif. codes: 0 '***' 0.001 '**' 0.01 '*' 0.05 '.' 0.1 ' ' 1Look at the results
Anova(m1, type = 3)Check the homogeneity of variance assumption
leveneTest(Loss ~ Treatment*Gender, data = ch16ds1)Draw an interaction plot
interaction.plot(x.factor = ch16ds1$Treatment,
                 trace.factor = ch16ds1$Gender,
                 response = ch16ds1$Loss)
interaction.plot(x.factor = ch16ds1$Treatment,
                 trace.factor = ch16ds1$Gender,
                 response = ch16ds1$Loss,
                 fixed = TRUE,
                 leg.bty = "b",
                 xlab = "Treatment",
                 ylab = "Weight Loss",
                 trace.label = "Gender",
                 ylim = c(60, 85))
library(HH)## 载入需要的程辑包:lattice## 载入需要的程辑包:grid## 载入需要的程辑包:latticeExtra##
## 载入程辑包:'latticeExtra'## The following object is masked from 'package:ggplot2':
##
## layer## 载入需要的程辑包:multcomp## 载入需要的程辑包:mvtnorm## 载入需要的程辑包:survival## 载入需要的程辑包:TH.data## 载入需要的程辑包:MASS##
## 载入程辑包:'MASS'## The following object is masked from 'package:dplyr':
##
## select##
## 载入程辑包:'TH.data'## The following object is masked from 'package:MASS':
##
## geyser## 载入需要的程辑包:gridExtra##
## 载入程辑包:'gridExtra'## The following object is masked from 'package:dplyr':
##
## combine##
## 载入程辑包:'HH'## The following objects are masked from 'package:car':
##
## logit, vif## The following object is masked from 'package:psych':
##
## logitinteraction2wt(data= ch16ds1,Loss~Treatment*Gender)
Compare the pairs of groups
TukeyHSD(m1)## Tukey multiple comparisons of means
## 95% family-wise confidence level
##
## Fit: aov(formula = Loss ~ Treatment + Gender + Treatment * Gender, data = ch16ds1)
##
## $Treatment
## diff lwr upr p adj
## Low Impact-High Impact -5.15 -11.83049 1.530493 0.1266935
##
## $Gender
## diff lwr upr p adj
## Male-Female 4.55 -2.130493 11.23049 0.1756979
##
## $`Treatment:Gender`
## diff lwr upr p adj
## Low Impact:Female-High Impact:Female -15.4 -27.94609 -2.85391 0.0110583
## High Impact:Male-High Impact:Female -5.7 -18.24609 6.84609 0.6162344
## Low Impact:Male-High Impact:Female -0.6 -13.14609 11.94609 0.9992219
## High Impact:Male-Low Impact:Female 9.7 -2.84609 22.24609 0.1782508
## Low Impact:Male-Low Impact:Female 14.8 2.25391 27.34609 0.0154282
## Low Impact:Male-High Impact:Male 5.1 -7.44609 17.64609 0.6949307
- 文章信息
- 作者: kaiwu
- 点击数:799

|
1980年 |
旅游业的贡献:文化遗产的保护与不同文化之间的相互理解 |
Tourism’s contribution to the preservation of culturalheritage and to peace and mutual understanding |
|
1981年 |
旅游业与生活质量 |
Tourism and the quality of life |
|
1982年 |
旅游业的骄傲:好的客人与好的主人 |
Pride in travel: good guests and good hosts |
|
1983年 |
旅游和假日对每个人来说既是权利也是责任 |
Travel and holidays are a right but also a responsibility forall |
|
1984年 |
为了国际间的理解、和平与合作的旅游 |
Tourism for international understanding, peace andcooperation |
|
1985年 |
年轻的旅游业:为了和平与友谊的文化和历史遗产 |
Youth tourism: cultural and historical heritage for peace andfriendship |
|
1986年 |
旅游:世界和平的重要力量 |
Tourism: a vital force for world peace |
|
1987年 |
旅游与发展 |
Tourism for development |
|
1988年 |
旅游:公众教育 |
Tourism: education for all |
|
1989年 |
旅游者的自由活动创造了一个共融的世界 |
The free movement of tourists creates one world |
|
1990年 |
认识旅游事业,发展旅游事业 |
Tourism: an unrecognized industry, a service to be released the hague declaration on tourism |
|
1991年 |
通信、信息和教育:旅游发展的动力 |
Communication, information and education: powerlines oftourism development |
|
1992年 |
旅游促进社会经济一体化,是各国人民相互了解的途径 |
Tourism: a factor of growing social and economic solidarityand of encounter between people |
|
1993年 |
争取旅游发展和环境保护的和谐 |
Tourism development and environmental protection: towards alasting harmony |
|
1994年 |
高质量的服务、高质量的员工、高质量的旅游 |
Quality staff, quality tourism |
|
1995年 |
通过负起责任而受益 |
WTO: serving world tourism for twenty years |
|
1996年 |
旅游业:宽容与和平的因素 |
Tourism: a factor of tolerance andpeace |
|
1997年 |
旅游业:21世纪创造就业和倡导环境保护的先导产业 |
Tourism: aleading activity of the twenty-first century for job creationand environmental protection |
|
1998年 |
政府与企业的伙伴关系:旅游开发和促销的关键 |
Public-privatesector partnership: the key to tourism development andpromotion |
|
1999年 |
旅游业:为新千年保护世界遗产 |
Tourism: preserving worldheritage for the new millennium |
|
2000年 |
技术和自然:21世纪旅游业的双重挑战 |
Technology and nature:two challenges for tourism at the start of the 21st century |
|
2001年 |
旅游业:为和平和不同文明之间对话服务的工具 |
Tourism:instrument at the service of peace and dialogue betweencivilizations |
|
2002年 |
经济旅游:可持续发展的关键 |
Ecotourism, the key to sustainabledevelopment |
|
2003年 |
旅游业:一种消除贫困、创造就业与社会和谐的驱动力 |
Tourism: a driving force for poverty alleviation, job creationand social harmony |
|
2004年 |
体育及旅游:社会相互了解、文化及发展的两股力量 |
Sport and tourism: two living forces for mutual understanding, culture and the development of societies |
|
2005年 |
旅游和交通:从儒勒·凡尔纳的科幻世界到21世纪的现实 |
Travel and transport: from the imaginary of Jules Verne to the reality of the 21st century |
|
2006年 |
旅游:让世界受益 |
Tourism enriches |
|
2007年 |
旅游:为妇女敞开大门 |
Tourism opens doors for women |
|
2008年 |
对气候变迁挑战的旅游回应 |
Tourism responding to the challenge of climate change |
|
2009年 |
旅游:庆祝多样性 |
Tourism – celebrating diversity |
|
2010年 |
旅游与生物多样性 |
Tourism and biological diversity |
|
2011年 |
旅游与文化连结 |
Tourism linking cultures |
|
2012年 |
旅游与能源永续 |
Tourism and energetic sustainability |
|
2013年 |
旅游与水:保护我们共同的未来 |
Tourism and water: protecting our common future |
|
2014年 |
旅游与社区发展 |
Tourism and development in the community |
|
2015年 |
10亿旅游者,10亿个机会 |
A billion tourists, a billion opportunities |
|
2016年 |
旅游促进发展,旅游促进扶贫,旅游促进和平 |
Promoting universal accessibility |
|
2017年 |
作为发展工具的可持续旅游 |
Sustainable tourism - a tool for development |
|
2018年 |
旅游数字化发展 |
Tourism and the digital transformation |
|
2019年 |
旅游业和工作:人人享有美好未来 |
Tourism and jobs: a better future for all |
|
2020年 |
旅游与乡村发展 |
Tourism and rural development |
|
2021年 |
旅游业促进包容性增长 |
Tourism for inclusive growth |
|
2022年 |
重新思考旅游业 |
Rethinking tourism |
- 文章信息
- 作者: kaiwu
- 点击数:677
参考网址:
https://www.worldatlas.com/articles/what-are-the-most-popular-sports-in-the-world.html
https://sportsbrowser.net/most-popular-sports/
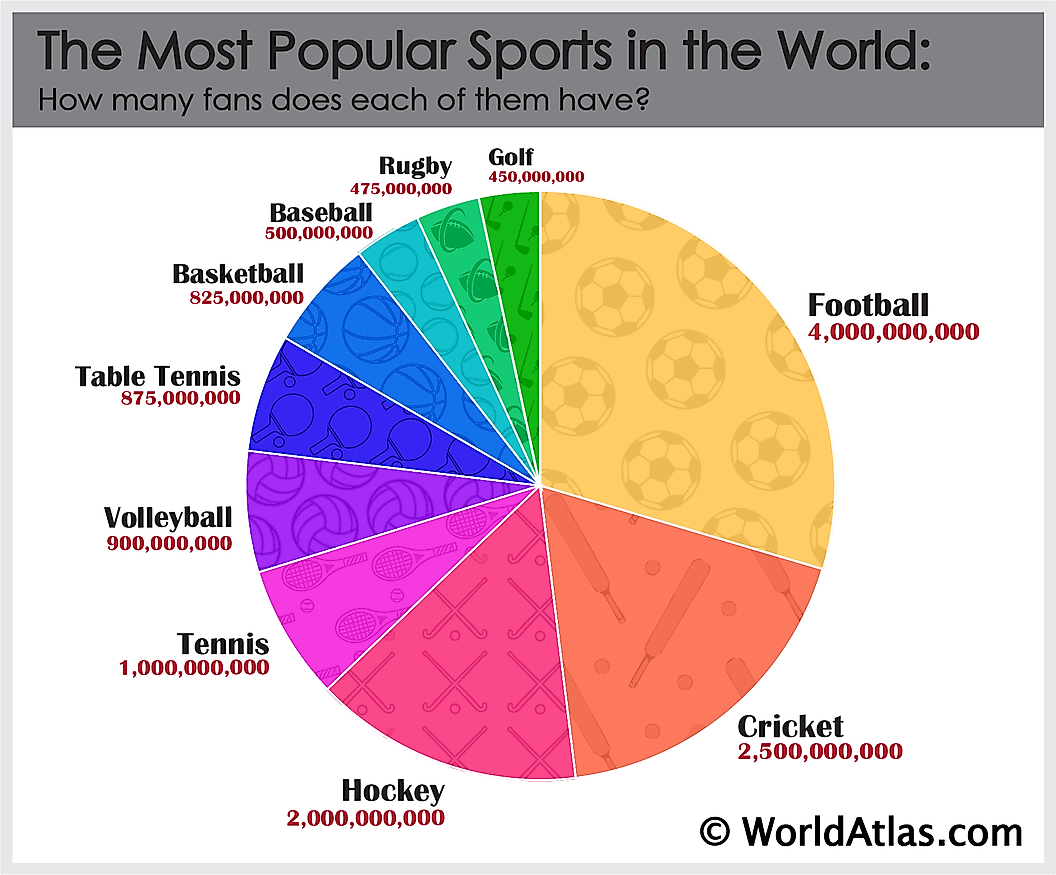
| Soccer (Association Football) | 足球 |
| Cricket | 板球 |
| Hockey (Ice and Field) | 曲棍球(冰上和场地) |
| Tennis | 网球 |
| Volleyball | 排球 |
| Table Tennis | 乒乓球 |
| Basketball | 篮球 |
| Baseball | 棒球 |
| Rugby | 橄榄球 |
| Golf | 高尔夫球 |
数据来源:https://www.worldatlas.com/articles/what-are-the-most-popular-sports-in-the-world.html