- 文章信息
- 作者: kaiwu
- 点击数:798
https://simple.wikipedia.org/wiki/Spreadsheet
A Spreadsheet is a computer program that imitates a paper worksheet. It shows a large sheet (like a sheet of paper) that has many cells in a grid of rows and columns. Users can put words or numbers into the cells, to make headings and store information (usually numbers). You can also move the grid lines around so that some cells are bigger than others, and change the color or size of text/font, the same way font/text is changed in a word processor. You can even put pictures in the worksheets, make multiple pages, and print out their results on real paper.
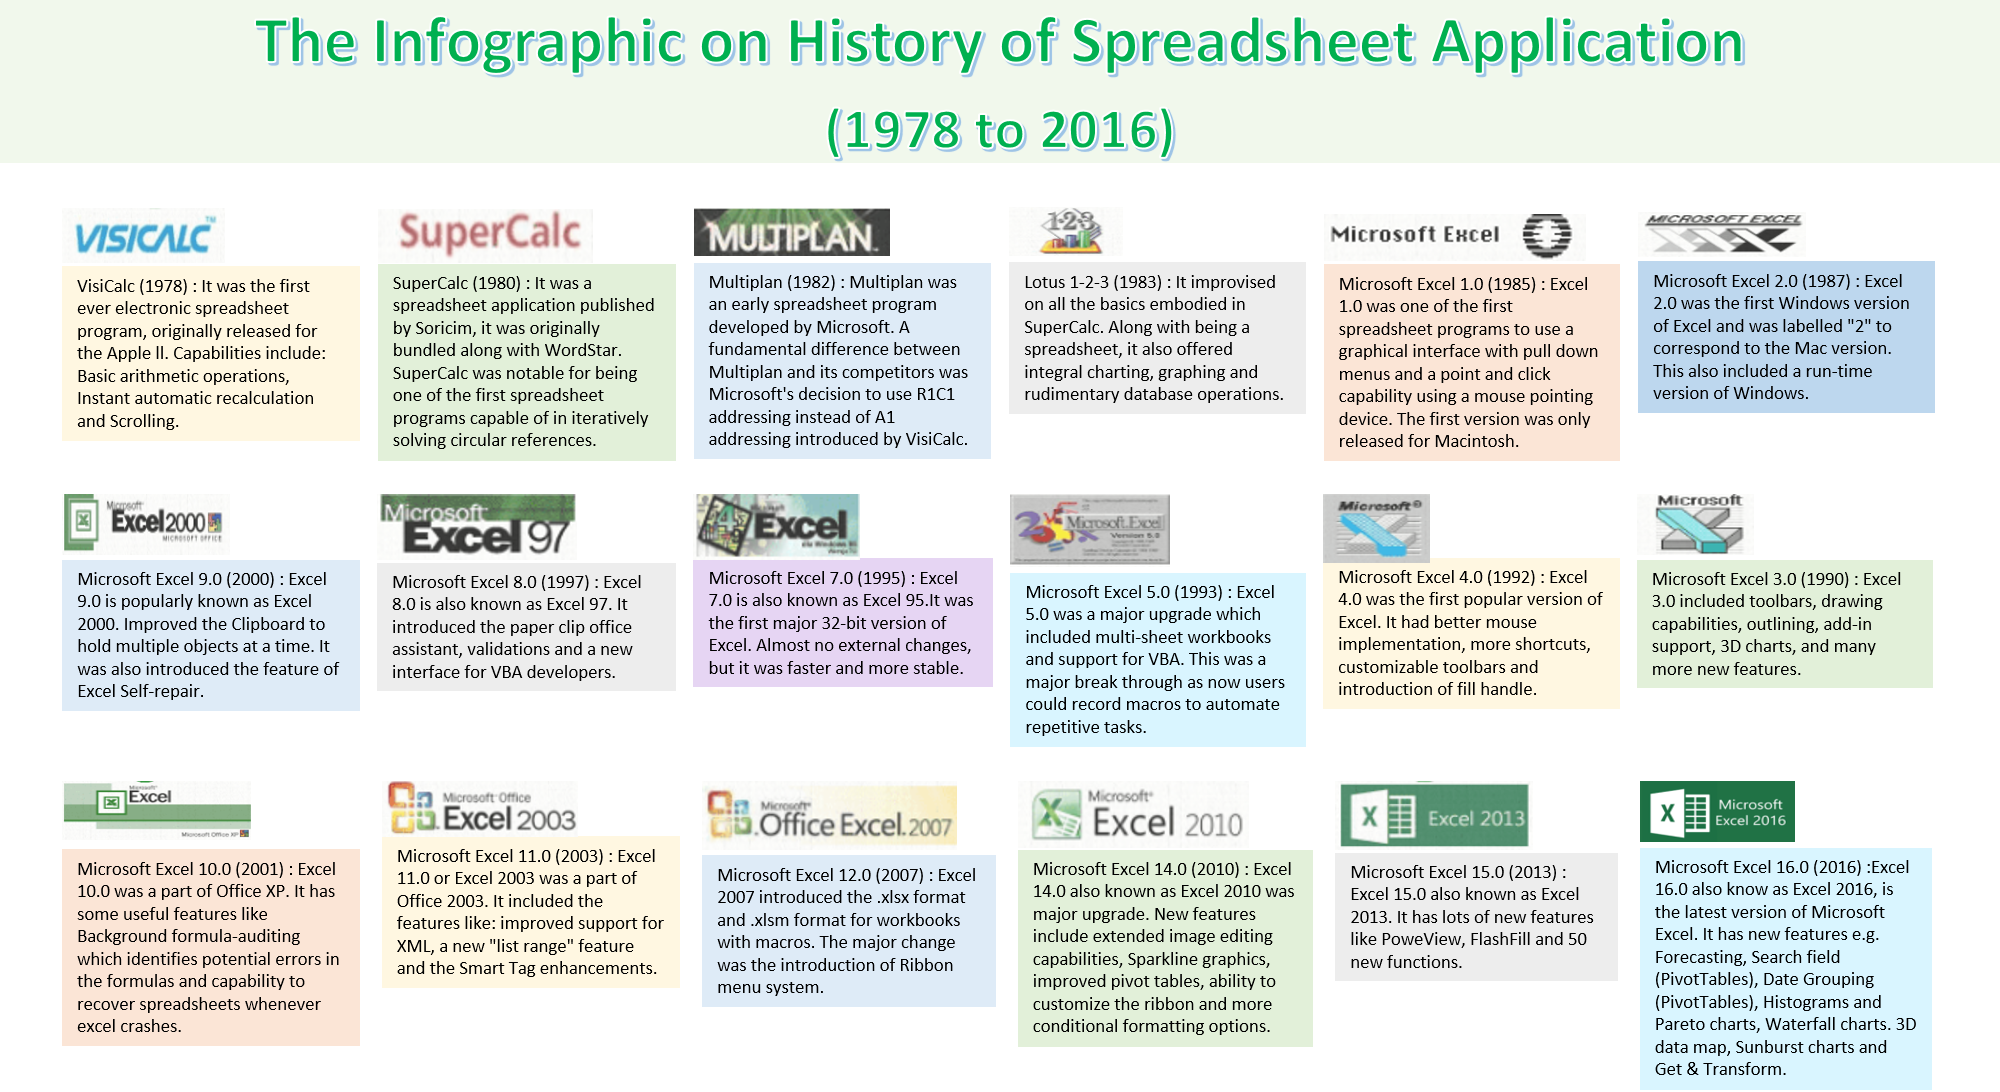
https://thedatalabs.org/wp-content/uploads/Excel/IntroductionToExcel/Infographics.png
software
Microsoft Excel
https://www.microsoft.com/en-us/microsoft-365/excel
Apple numbers
https://www.apple.com/numbers/
Google sheets
https://www.google.com/sheets/about/
zoho sheet
liboffice
openoffice
WPS(金山文档)
腾讯文档
腾讯office
飞书文档
石墨文档
一起写
books on spreadsheet
- Carroll, J. (2019). Beyond Spreadsheets with R: A Beginner’s Guide to R and Rstudio. Manning.
- Baker, K. R. (2015). Optimization Modeling with Spreadsheets. Wiley. DOI: 10.1002/9780470949108
- Powell, S. G., & Baker, K. R. (2014). Management science: The art of modeling with spreadsheets (4th). Wiley.
- Hillier, F. S., Hillier, M. S., Schmedders, K., & Stephens, M. (2014). Introduction to Management Science Modeling and Case Studies Approach with Spreadsheets. McGraw-Hill Irwin.
- Etheridge, D. (2010). Excel programming: Your visual blueprint for creating interactive spreadsheets (3rd). Wiley. http://www.wiley.com/WileyCDA/WileyTitle/productCd-0470591595.html
- Zhu, J. (2009). Quantitative models for performance evaluation and benchmarking: Data Envelopment Analysis with Spreadsheets. Springer. DOI: 10.1007/978-1-4757-4246-6
- Jechlitschka, K. (2007). Microeconomics using Excel: Integrating economic theory, policy analysis and spreadsheet modelling. Routledge. DOI: 10.4324/9780203931103
- 丁以中, & Shang, J. S. (2003). 管理科学——运用 Spreadsheet 建模和求解. 清华大学出版社.
- 文章信息
- 作者: kaiwu
- 点击数:1919
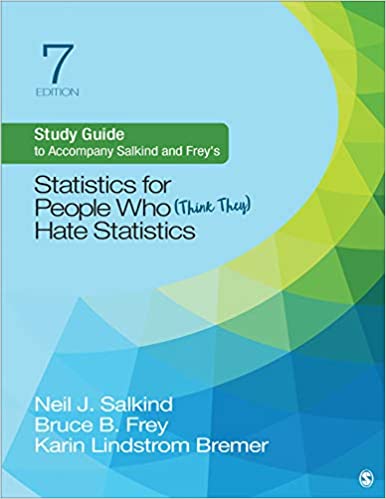
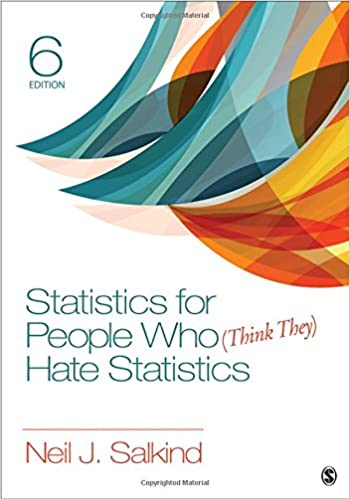
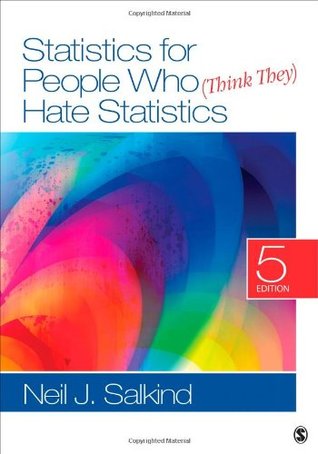
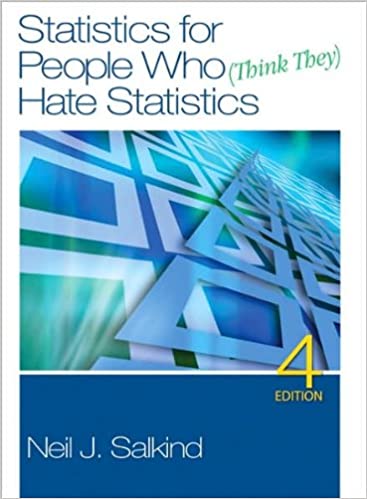
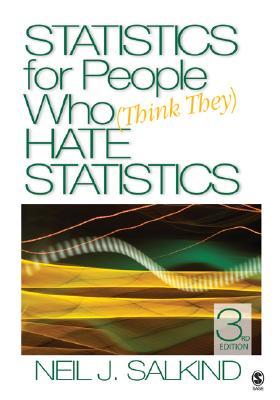
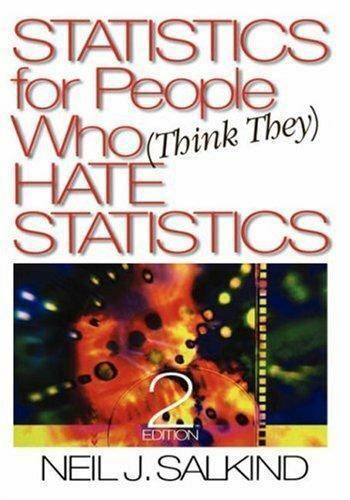
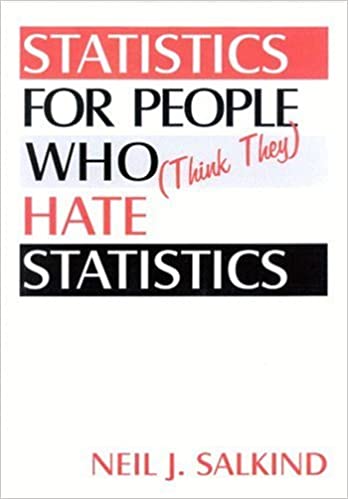
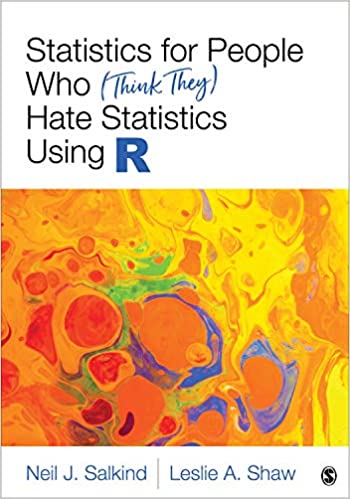
经典教材:爱上统计学Statistics for People Who (think They) Hate Statistics
作者:Neil J. Salkind(1947-2017)
https://www.findagrave.com/memorial/192090437/neil-j-salkind
https://www.socialsciencespace.com/2017/11/gentle-guide-neil-salkind-1947-2017/

The gentle good humor of that answer imbues one of his enduring efforts for SAGE Publishing, the Statistics for People Who (Think They) Hate Statistics books.
“Neil Salkind’s statistics textbooks were so successful because Neil had a unique gift for communicating an often-intimidating subject in a playful and humorous way,” recalled Helen Salmon, a senior acquisitions editor with SAGE. “His bestselling Statistics for People Who (Think They) Hate Statistics put students at ease, without being condescending. Neil was incredibly generous with his time and expertise: he published his email address in the front of his books, and would respond to several emails a day from students from around the world who asked for his advice and help. He was a wonderful author to work with, as he was always dreaming up the next project.”
https://uk.sagepub.com/en-gb/asi/author/neil-joseph-salkind
https://www.amazon.com/Neil-J.-Salkind/e/B000APV1GM
https://www.goodreads.com/author/show/8442.Neil_J_Salkind
Book Reviews:
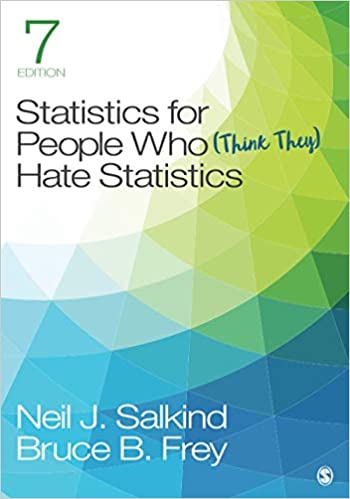
Salkind, N. J., Frey, B. B., & Lindstrom, K. (2019). Study Guide to Accompany Salkind and Frey′s Statistics for People Who (Think They) Hate Statistics (7th ed.). Sage.
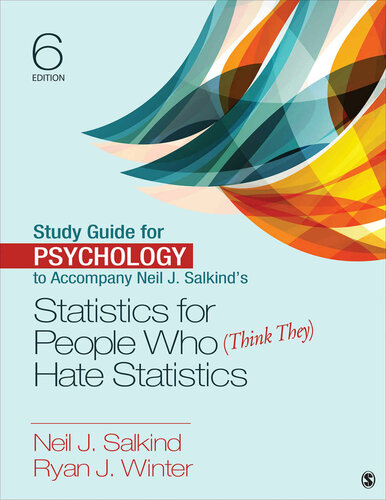
Salkind, N. J., Frey, B. B., & Winter, R. J. (2019). Study Guide for Psychology to Accompany Salkind and Frey′s Statistics for People Who (Think They) Hate Statistics (7th ed.). Sage.
Salkind, N. J., Frey, B. B., & Wood, M. M. (2019). Study Guide for Health & Nursing to Accompany Salkind & Frey′s Statistics for People Who (Think They) Hate Statistics (7th ed.). Sage.
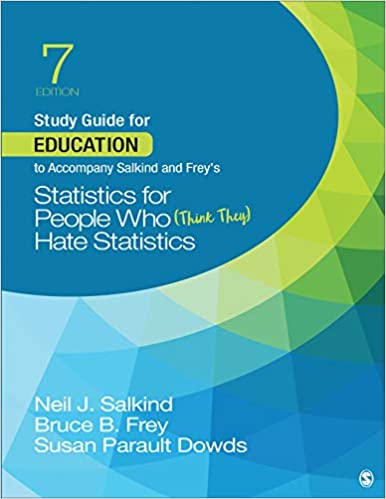
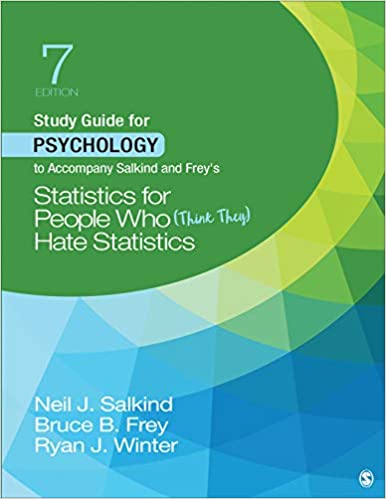
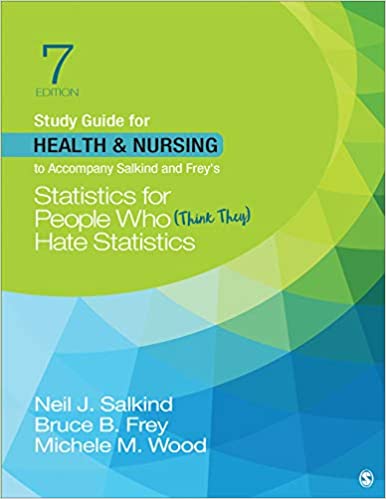
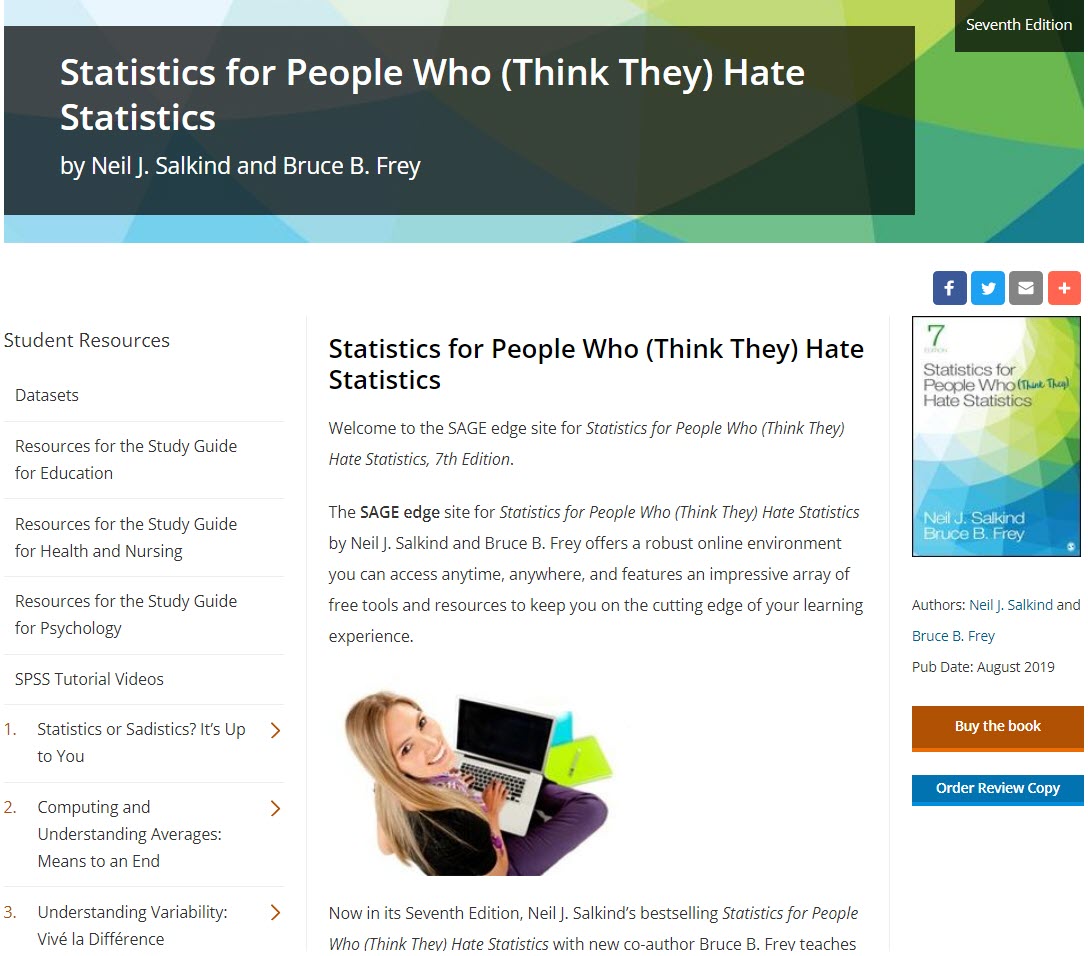
https://edge.sagepub.com/salkindfrey7e


- 文章信息
- 作者: kaiwu
- 点击数:1234
经典教材:改变心理学的40项研究: 探寻心理学研究的历史

https://www.mendocino.edu/faculty/roger-hock
https://www.goodreads.com/book/show/361298.Forty_Studies_That_Changed_Psychology
https://en.wikipedia.org/wiki/Forty_Studies_That_Changed_Psychology
Forty Studies That Changed Psychology: Explorations Into the History of Psychological Research is an academic textbook written by Roger R. Hock that is currently in its eighth edition. The book provides summaries, critiques, and updates on important research that has impacted the field of psychology. The textbook is used in psychology courses at all levels of education and has been translated into six languages. It is used to properly relate the present knowledge of psychology with the original research that led to it. It is a window into the history of psychology for anyone wishing to expand their understanding of the true roots of psychology
Book Reviews:
Roger R. Hock.(2019). Forty studies that changed psychology: Explorations into the history of psychological research (8th ed.). Pearson.
https://www.amazon.com/dp/0135166489
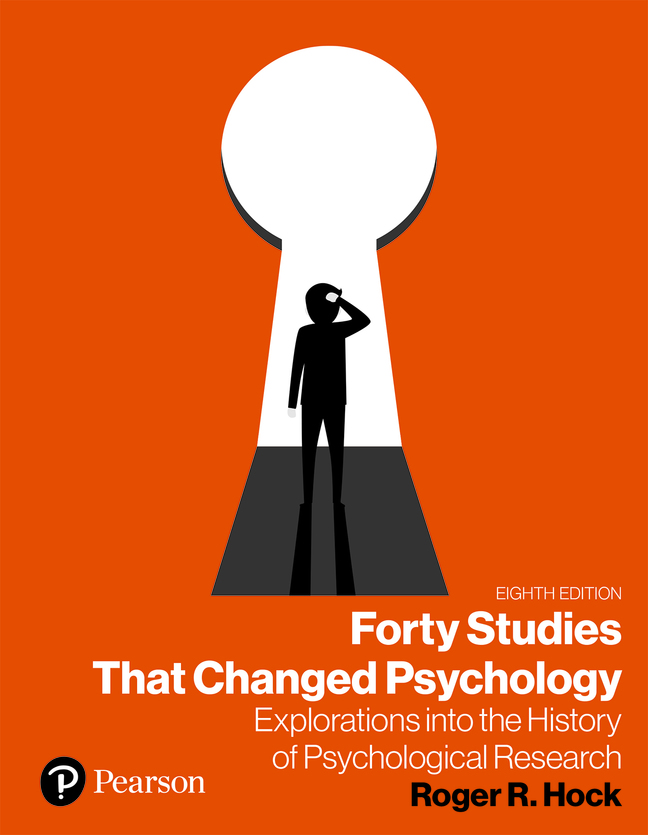
Roger R. Hock. (2021). 改变心理学的40项研究(第8版) (白学军翻译). 人民邮电出版社.




- 文章信息
- 作者: kaiwu
- 点击数:2700
for loop
add image
execution time
barchart(ylimit, vertical bar chart, add labels, frequency analysis)
R Notebook
0. load data
for(i in 1:13){
  load(file=paste0("D:/datasets/citations_data/tourism_satisfaction2021/M",i,".rda"))
}
1. create m_matrix: first line
m_matrix<-as.data.frame(t(c(1,"AU","M1")))
colnames(m_matrix)<-c("col_id","col_names","from_data")
2. loop for 13 sections
# mlist includes the names of the data frame

mlist<-as.data.frame(c('M1','M2','M3','M4','M5','M6','M7','M8','M9','M10','M11','M12','M13'))

for(i in 1:13){
  temp<-get(mlist[i,1])

  # temp is the dataframe

  c1<-1:ncol(temp)      # variable's position
  c2<-colnames(temp)    # variable's name
  c3<-rep(mlist[i,1],ncol(temp)) # section's name

  c123<-as.data.frame(cbind(c1,c2,c3))

  colnames(c123)<-c("col_id","col_names","from_data")

  # rbind
  m_matrix<-rbind(m_matrix,c123)

}
# delete the first row
m_matrix<-m_matrix[-1,]
3. frequency analysis
freq_variable<-as.data.frame(table(m_matrix[,2]))

# filter Freq < 13
freq_variable2<-subset(freq_variable,Freq<13)
4. plot of frequency
library(ggplot2)

Plot_variables<-ggplot(freq_variable2, aes(x = Var1, y = Freq)) +
  geom_col(fill = "lightblue", colour = "grey60", binwidth=10) +
  geom_density(colour="red") +
  ylim(0,max(freq_variable2$Freq)*1.1)+
  geom_text(aes(label = Freq), hjust = -0.5)+
  coord_flip()
Warning: Ignoring unknown parameters: binwidthPlot_variablesWarning: Groups with fewer than two data points have been dropped.
Warning: Groups with fewer than two data points have been dropped.
Warning: Groups with fewer than two data points have been dropped.
Warning: Groups with fewer than two data points have been dropped.
Warning: Groups with fewer than two data points have been dropped.
Warning: Groups with fewer than two data points have been dropped.
Warning: Groups with fewer than two data points have been dropped.
Warning in max(ids, na.rm = TRUE) :
no non-missing arguments to max; returning -Inf
Warning in max(ids, na.rm = TRUE) :
no non-missing arguments to max; returning -Inf
Warning in max(ids, na.rm = TRUE) :
no non-missing arguments to max; returning -Inf
Warning in max(ids, na.rm = TRUE) :
no non-missing arguments to max; returning -Inf
Warning in max(ids, na.rm = TRUE) :
no non-missing arguments to max; returning -Inf
Warning in max(ids, na.rm = TRUE) :
no non-missing arguments to max; returning -Inf
Warning in max(ids, na.rm = TRUE) :
no non-missing arguments to max; returning -Inf5. variable_matrix
start_time <- Sys.time()
colid_matrix<-freq_variable
for(i in 1:nrow(m_matrix)){
  # all 596 rows
  for(j in 1:nrow(mlist)){
    # j is for the 13 sections
    for(m in 1:nrow(colid_matrix)){
      # m is for the final matix: variables
      if((colid_matrix[m,1]==m_matrix[i,2]) &(mlist[j,1]==m_matrix[i,3]) ){
        colid_matrix[m,mlist[j,1]]<-m_matrix[i,1]
      }
    }
  }

}
end_time <- Sys.time()
end_time - start_time
Time difference of 27.44249 secs- 文章信息
- 作者: kaiwu
- 点击数:1109
From Wikipedia, the free encyclopedia
Generative Pre-trained Transformer 3 (GPT-3) is an autoregressive language model that uses deep learning to produce human-like text.
It is the third-generation language prediction model in the GPT-n series (and the successor to GPT-2) created by OpenAI, a San Francisco-based artificial intelligence research laboratory.[2] GPT-3's full version has a capacity of 175 billion machine learning parameters. GPT-3, which was introduced in May 2020, and was in beta testing as of July 2020,[3] is part of a trend in natural language processing (NLP) systems of pre-trained language representations.
This is a real example, see https://www.ambrogiorobot.com/en. Disclosure: LF owns one.
See https://en.wikipedia.org/wiki/ELIZA. A classic book still worth reading on the ELIZA effect and AI in general is (Weizenbaum 1976). In 2014 some people claimed, mistakenly, that a chatbot had passed the test. Its name is “Eugene Goostman”, and you can check it by yourself, by playing with it here: http://eugenegoostman.elasticbeanstalk.com/. When it was tested, I was one of the judges, and what I noticed was that it was some humans who failed to pass the test, asking the sort of questions that I have called here “irreversible”, such as (real examples, these were asked by a BBC journalist) “do you believe in God?” and “do you like ice-cream”. Even a simple machine tossing coins would “pass” that kind of test.
See for example the Winograd Schema Challenge (Levesque et al. 2012).
For an excellent, technical and critical analysis, see McAteer (https://matthewmcateer.me/blog/messing-with-gpt-3/ ." data-track="click" data-track-action="reference anchor" data-track-label="link" data-test="citation-ref" aria-label="Reference 2020">2020). About the “completely unrealistic expectations about what large-scale language models such as GPT-3 can do” see Yann LeCun (Vice President, Chief AI Scientist at Facebook App) here: https://www.facebook.com/yann.lecun/posts/10157253205637143.
The following note was written by the journalists, not the software: “[…] GPT-3 produced eight different outputs, or essays. Each was unique, interesting and advanced a different argument. The Guardian could have just run one of the essays in its entirety. However, we chose instead to pick the best parts of each, in order to capture the different styles and registers of the AI. Editing GPT-3’s op-ed was no different to editing a human op-ed. We cut lines and paragraphs, and rearranged the order of them in some places. Overall, it took less time to edit than many human op-eds.” (GPT-3 2020).
For some philosophical examples concerning GPT-3, see http://dailynous.com/2020/07/30/philosophers-gpt-3/.
For a more extended, and sometimes quite entertaining, analysis see (Lacker https://lacker.io/ai/2020/07/06/giving-gpt-3-a-turing-test.html ." data-track="click" data-track-action="reference anchor" data-track-label="link" data-test="citation-ref" aria-label="Reference 2020">2020).
For an interesting analysis see (Elkins and Chun 2020).


