
- 文章信息
- 作者: kaiwu
- 点击数:533
https://www.ibm.com/docs/zh/spss-statistics/29.0.0?topic=reference-ctables
SPSS custom table
CTABLES
/VLABELS VARIABLES=MR1 MR2 MR3 MR4 MR5 MR6 gender DISPLAY=BOTH
/TABLE imd1[MEAN F40.2]+ imd2[MEAN F40.2]+ imd3[MEAN F40.2]+ imd4[MEAN F40.2]+ imd5[MEAN F40.2]+ imd6[MEAN F40.2] BY gender [C]
/CATEGORIES VARIABLES= gender ORDER=A KEY=VALUE EMPTY=INCLUDE
/CRITERIA CILEVEL=95.
---------
| gender 性别 | ||
| 男 | 女 | |
| imd1 | 3.05 | 3.35 |
| imd2 | 3.28 | 3.55 |
| imd3 | 4.11 | 4.11 |
| imd4 | 3.92 | 3.85 |
| imd5 | 3.67 | 3.76 |
| imd6 | 3.87 | 3.91 |
* 包含了卡方检验-------------频数表.
CTABLES
/VLABELS VARIABLES=nage_range newincome edu gender DISPLAY=BOTH
/TABLE nage_range + newincome + edu BY gender [C] [COUNT F40.0]
/CATEGORIES VARIABLES=nage_range newincome edu ORDER=A KEY=VALUE EMPTY=INCLUDE
/CRITERIA CILEVEL=95
/SIGTEST TYPE=CHISQUARE ALPHA=0.05 INCLUDEMRSETS=YES CATEGORIES=ALLVISIBLE.
| gender 性别 | |||
| 男 | 女 | ||
| 年龄段 | 25岁以下 | 48 | 86 |
| 26~35 | 31 | 54 | |
| 36~45 | 50 | 50 | |
| 46~55 | 30 | 20 | |
| 56岁以上 | 15 | 4 | |
| 收入段 | 2000元以下 | 34 | 66 |
| 2001-4000元 | 32 | 46 | |
| 4001-6000元 | 60 | 50 | |
| 6001-8000元 | 18 | 28 | |
| 8000元以上 | 30 | 24 | |
| 受教育程度 | 初中及以下 | 18 | 2 |
| 高中 | 17 | 12 | |
| 大专或高职 | 30 | 34 | |
| 本科 | 75 | 124 | |
| 硕士研究生 | 22 | 30 | |
| 博士研究生 | 12 | 12 |
* 人口统计变量的分组比较——行百分比.
CTABLES
/VLABELS VARIABLES=nage_range newincome edu gender DISPLAY=BOTH
/TABLE nage_range + newincome + edu BY gender [C][ROWPCT.COUNT ]
/CATEGORIES VARIABLES=nage_range newincome edu ORDER=A KEY=VALUE EMPTY=INCLUDE
/CRITERIA CILEVEL=95
/SIGTEST TYPE=CHISQUARE ALPHA=0.05 INCLUDEMRSETS=YES CATEGORIES=ALLVISIBLE.
| gender 性别 | |||
| 男 | 女 | ||
| 行 N % | 行 N % | ||
| 年龄段 | 25岁以下 | 35.8% | 64.2% |
| 26~35 | 36.5% | 63.5% | |
| 36~45 | 50.0% | 50.0% | |
| 46~55 | 60.0% | 40.0% | |
| 56岁以上 | 78.9% | 21.1% | |
| 收入段 | 2000元以下 | 34.0% | 66.0% |
| 2001-4000元 | 41.0% | 59.0% | |
| 4001-6000元 | 54.5% | 45.5% | |
| 6001-8000元 | 39.1% | 60.9% | |
| 8000元以上 | 55.6% | 44.4% | |
| 受教育程度 | 初中及以下 | 90.0% | 10.0% |
| 高中 | 58.6% | 41.4% | |
| 大专或高职 | 46.9% | 53.1% | |
| 本科 | 37.7% | 62.3% | |
| 硕士研究生 | 42.3% | 57.7% | |
| 博士研究生 | 50.0% | 50.0% |
* 人口统计变量的分组比较——列百分比.
CTABLES
/VLABELS VARIABLES=nage_range newincome edu gender DISPLAY=BOTH
/TABLE nage_range + newincome + edu BY gender [C][COLPCT.COUNT ]
/CATEGORIES VARIABLES=nage_range newincome edu ORDER=A KEY=VALUE EMPTY=INCLUDE
/CRITERIA CILEVEL=95
/SIGTEST TYPE=CHISQUARE ALPHA=0.05 INCLUDEMRSETS=YES CATEGORIES=ALLVISIBLE.
| gender 性别 | |||
| 男 | 女 | ||
| 列 N % | 列 N % | ||
| 年龄段 | 25岁以下 | 27.6% | 40.2% |
| 26~35 | 17.8% | 25.2% | |
| 36~45 | 28.7% | 23.4% | |
| 46~55 | 17.2% | 9.3% | |
| 56岁以上 | 8.6% | 1.9% | |
| 收入段 | 2000元以下 | 19.5% | 30.8% |
| 2001-4000元 | 18.4% | 21.5% | |
| 4001-6000元 | 34.5% | 23.4% | |
| 6001-8000元 | 10.3% | 13.1% | |
| 8000元以上 | 17.2% | 11.2% | |
| 受教育程度 | 初中及以下 | 10.3% | 0.9% |
| 高中 | 9.8% | 5.6% | |
| 大专或高职 | 17.2% | 15.9% | |
| 本科 | 43.1% | 57.9% | |
| 硕士研究生 | 12.6% | 14.0% | |
| 博士研究生 | 6.9% | 5.6% |
* 人口统计变量的分组比较——全表百分比.
CTABLES
/VLABELS VARIABLES=nage_range newincome edu gender DISPLAY=BOTH
/TABLE nage_range + newincome + edu BY gender [C][TABLEPCT.COUNT ]
/CATEGORIES VARIABLES=nage_range newincome edu ORDER=A KEY=VALUE EMPTY=INCLUDE
/CRITERIA CILEVEL=95
/SIGTEST TYPE=CHISQUARE ALPHA=0.05 INCLUDEMRSETS=YES CATEGORIES=ALLVISIBLE.
| gender 性别 | |||
| 男 | 女 | ||
| 表 N % | 表 N % | ||
| 年龄段 | 25岁以下 | 12.4% | 22.2% |
| 26~35 | 8.0% | 13.9% | |
| 36~45 | 12.9% | 12.9% | |
| 46~55 | 7.7% | 5.2% | |
| 56岁以上 | 3.9% | 1.0% | |
| 收入段 | 2000元以下 | 8.8% | 17.0% |
| 2001-4000元 | 8.2% | 11.9% | |
| 4001-6000元 | 15.5% | 12.9% | |
| 6001-8000元 | 4.6% | 7.2% | |
| 8000元以上 | 7.7% | 6.2% | |
| 受教育程度 | 初中及以下 | 4.6% | 0.5% |
| 高中 | 4.4% | 3.1% | |
| 大专或高职 | 7.7% | 8.8% | |
| 本科 | 19.3% | 32.0% | |
| 硕士研究生 | 5.7% | 7.7% | |
| 博士研究生 | 3.1% | 3.1% |
CTABLES
/VLABELS VARIABLES=gender age4 region income_range te_range DISPLAY=LABEL
/TABLE age4> sat2 [S][MEAN F40.2] + region > sat2 [S][MEAN F40.2]+ income_range > sat2 [S][MEAN F40.2] + te_range > sat2 [S][MEAN F40.2] by gender.
|
Function |
Description |
Default Label* |
Default Format |
|
COUNT |
Number of cases in each category. This is the default for categorical and multiple response variables. |
Count |
Count |
|
ROWPCT.COUNT |
Row percentage based on cell counts. Computed within subtable. |
Row % |
Percent |
|
COLPCT.COUNT |
Column percentage based on cell counts. Computed within subtable. |
Column % |
Percent |
|
TABLEPCT.COUNT |
Table percentage based on cell counts. |
Table % |
Percent |
|
SUBTABLEPCT.COUNT |
Subtable percentage based on cell counts. |
Subtable % |
Percent |
|
LAYERPCT.COUNT |
Layer percentage based on cell counts. Same as table percentage if no layers are defined. |
Layer % |
Percent |
|
LAYERROWPCT.COUNT |
Row percentage based on cell counts. Percentages sum to 100% across the entire row (that is, across subtables). |
Layer Row % |
Percent |
|
LAYERCOLPCT.COUNT |
Column percentage based on cell counts. Percentages sum to 100% across the entire column (that is, across subtables). |
Layer Column % |
Percent |
|
ROWPCT.VALIDN |
Row percentage based on valid count. |
Row Valid N % |
Percent |
|
COLPCT.VALIDN |
Column percentage based on valid count. |
Column Valid N % |
Percent |
|
TABLEPCT.VALIDN |
Table percentage based on valid count. |
Table Valid N % |
Percent |
|
SUBTABLEPCT.VALIDN |
Subtable percentage based on valid count. |
Subtable Valid N % |
Percent |
|
LAYERPCT.VALIDN |
Layer percentage based on valid count. |
Layer Valid N % |
Percent |
|
LAYERROWPCT.VALIDN |
Row percentage based on valid count. Percentages sum to 100% across the entire row. |
Layer Row Valid N % |
Percent |
|
LAYERCOLPCT.VALIDN |
Column percentage based on valid count. Percentages sum to 100% across the entire column. |
Layer Column Valid N % |
Percent |
|
ROWPCT.TOTALN |
Row percentage based on total count, including user-missing and system-missing values. |
Row Total N % |
Percent |
|
COLPCT.TOTALN |
Column percentage based on total count, including user-missing and system-missing values. |
Column Total N % |
Percent |
|
TABLEPCT.TOTALN |
Table percentage based on total count, including user-missing and system-missing values. |
Table Total N % |
Percent |
|
SUBTABLEPCT.TOTALN |
Subtable percentage based on total count, including user-missing and system-missing values. |
Subtable Total N % |
Percent |
|
LAYERPCT.TOTALN |
Layer percentage based on total count, including user-missing and system-missing values. |
Layer Total N % |
Percent |
|
LAYERROWPCT.TOTALN |
Row percentage based on total count, including user-missing and system-missing values. Percentages sum to 100% across the entire row. |
Layer Row Total N % |
Percent |
|
LAYERCOLPCT.TOTALN |
Column percentage based on total count, including user-missing and system-missing values. Percentages sum to 100% across the entire column. |
Layer Column Total N % |
Percent |
*This is the default on a U.S.-English system.
The.COUNTsuffix can be omitted from percentages that are based on cell counts. Thus,ROWPCTis equivalent toROWPCT.COUNT.
|
Function |
Description |
Default Label |
Default Format |
|
MAXIMUM |
Largest value. |
Maximum |
General |
|
MEAN |
Arithmetic mean. The default for scale variables. |
Mean |
General |
|
MEDIAN |
50th percentile. |
Median |
General |
|
MINIMUM |
Smallest value. |
Minimum |
General |
|
MISSING |
Count of missing values (both user-missing and system-missing). |
Missing |
General |
|
MODE |
Most frequent value. If there is a tie, the smallest value is shown. |
Mode |
General |
|
PTILE |
Percentile. Takes a numeric value between 0 and 100 as a required parameter. PTILE is computed the same way as APTILE in the TABLES command. Note that in the TABLES command, the default percentile method was HPTILE. |
Percentile ####.## |
General |
|
RANGE |
Difference between maximum and minimum values. |
Range |
General |
|
SEMEAN |
Standard error of the mean. |
Std Error of Mean |
General |
|
STDDEV |
Standard deviation. |
Std Deviation |
General |
|
SUM |
Sum of values. |
Sum |
General |
|
TOTALN |
Count of nonmissing, user-missing, and system-missing values. The count excludes valid values hidden via the CATEGORIES subcommand. |
Total N |
Count |
|
VALIDN |
Count of nonmissing values. |
Valid N |
Count |
|
VARIANCE |
Variance. |
Variance |
General |
|
ROWPCT.SUM |
Row percentage based on sums. |
Row Sum % |
Percent |
|
COLPCT.SUM |
Column percentage based on sums. |
Column Sum % |
Percent |
|
TABLEPCT.SUM |
Table percentage based on sums. |
Table Sum % |
Percent |
|
SUBTABLEPCT.SUM |
Subtable percentage based on sums. |
Subtable Sum % |
Percent |
|
LAYERPCT.SUM |
Layer percentage based on sums. |
Layer Sum % |
Percent |
|
LAYERROWPCT.SUM |
Row percentage based on sums. Percentages sum to 100% across the entire row. |
Layer Row Sum % |
Percent |
|
LAYERCOLPCT.SUM |
Column percentage based on sums. Percentages sum to 100% across the entire column. |
Layer Column Sum % |
Percent |
|
Function |
Description |
Default Label |
Default Format |
|
RESPONSES |
Count of responses. |
Responses |
Count |
|
ROWPCT.RESPONSES |
Row percentage based on responses. Total number of responses is the denominator. |
Row Responses % |
Percent |
|
COLPCT.RESPONSES |
Column percentage based on responses. Total number of responses is the denominator. |
Column Responses % |
Percent |
|
TABLEPCT.RESPONSES |
Table percentage based on responses. Total number of responses is the denominator. |
Table Responses % |
Percent |
|
SUBTABLEPCT.RESPONSES |
Subtable percentage based on responses. Total number of responses is the denominator. |
Subtable Responses % |
Percent |
|
LAYERPCT.RESPONSES |
Layer percentage based on responses. Total number of responses is the denominator. |
Layer Responses % |
Percent |
|
LAYERROWPCT.RESPONSES |
Row percentage based on responses. Total number of responses is the denominator. Percentages sum to 100% across the entire row (that is, across subtables). |
Layer Row Responses % |
Percent |
|
LAYERCOLPCT.RESPONSES |
Column percentage based on responses. Total number of responses is the denominator. Percentages sum to 100% across the entire column (that is, across subtables). |
Layer Column Responses % |
Percent |
|
ROWPCT.RESPONSES.COUNT |
Row percentage: Responses are the numerator, and total count is the denominator. |
Row Responses % (Base: Count) |
Percent |
|
COLPCT.RESPONSES.COUNT |
Column percentage: Responses are the numerator, and total count is the denominator. |
Column Responses % (Base: Count) |
Percent |
|
TABLEPCT.RESPONSES.COUNT |
Table percentage: Responses are the numerator, and total count is the denominator. |
Table Responses % (Base: Count) |
Percent |
|
SUBTABLEPCT.RESPONSES.COUNT |
Subtable percentage: Responses are the numerator, and total count is the denominator. |
Subtable Responses % (Base: Count) |
Percent |
|
LAYERPCT.RESPONSES.COUNT |
Layer percentage: Responses are the numerator, and total count is the denominator. |
Layer Responses % (Base: Count) |
Percent |
|
LAYERROWPCT.RESPONSES.COUNT |
Row percentage: Responses are the numerator, and total count is the denominator. Percentages sum to 100% across the entire row (that is, across subtables). |
Layer Row Responses % (Base: Count) |
Percent |
|
LAYERCOLPCT.RESPONSES.COUNT |
Column percentage: Responses are the numerator, and total count is the denominator. Percentages sum to 100% across the entire column (that is, across subtables). |
Layer Column Responses % (Base: Count) |
Percent |
|
ROWPCT.COUNT.RESPONSES |
Row percentage: Count is the numerator, and total responses are the denominator. |
Row Count % (Base: Responses) |
Percent |
|
COLPCT.COUNT.RESPONSES |
Column percentage: Count is the numerator, and total responses are the denominator. |
Column Count % (Base: Responses) |
Percent |
|
TABLEPCT.COUNT.RESPONSES |
Table percentage: Count is the numerator, and total responses are the denominator. |
Table Count % (Base: Responses) |
Percent |
|
SUBTABLEPCT.COUNT. RESPONSES |
Subtable percentage: Count is the numerator, and total responses are the denominator. |
Subtable Count % (Base: Responses) |
Percent |
|
LAYERPCT.COUNT. RESPONSES |
Layer percentage: Count is the numerator, and total responses are the denominator. |
Layer Count % (Base: Responses) |
Percent |
|
LAYERROWPCT.COUNT.RESPONSES |
Row percentage: Count is the numerator, and total responses are the denominator. Percentages sum to 100% across the entire row (that is, across subtables). |
Layer Row Count % (Base: Responses) |
Percent |
|
LAYERCOLPCT.COUNT.RESPONSES |
Row percentage: Count is the numerator, and total responses are the denominator. Percentages sum to 100% across the entire column (that is, across subtables). |
Layer Column Count % (Base: Responses) |
Percent |
- 文章信息
- 作者: kaiwu
- 点击数:587
https://www.ibm.com/docs/zh/spss-statistics/29.0.0?topic=reference-ctables
example data

https://od.lk/d/178307401_DLXGb/tourist_enlabels.sav
SPSS custom table
CTABLES
/VLABELS VARIABLES=gender age_range4 region income_range3 expense_range4 DISPLAY=LABEL
/TABLE age_range4 + region + income_range3 + expense_range4 + gender [COUNT F40.0]
/CATEGORIES VARIABLES= age_range4 region income_range3 expense_range4 ORDER=A KEY=VALUE EMPTY=INCLUDE.
| variable | count | |
| age_range4 | below 20 | 39 |
| 20-40 | 127 | |
| 40-60 | 143 | |
| above 60 | 64 | |
| region | Central China | 62 |
| East China | 60 | |
| North China | 62 | |
| Northeast China | 45 | |
| Northwest China | 48 | |
| Southwest China | 57 | |
| West China | 39 | |
| income per capita | Lowest thru 1999 | 76 |
| 2000-2999 | 191 | |
| 3000 thru Highest | 106 | |
| average expense per capita | Lowest thru 299 | 152 |
| 300-399 | 144 | |
| 400-499 | 71 | |
| 500 thru Highest | 6 | |
| gender | male | 214 |
| female | 159 | |
CTABLES
/VLABELS VARIABLES=gender age_range4 region income_range3 expense_range4 DISPLAY=LABEL
/TABLE gender[COUNT F40.0, COLPCT.COUNT PCT40.1]+ age_range4[COUNT F40.0, COLPCT.COUNT PCT40.1] + region[COUNT F40.0, COLPCT.COUNT PCT40.1] + income_range3[COUNT F40.0, COLPCT.COUNT PCT40.1] + expense_range4 [COUNT F40.0, COLPCT.COUNT PCT40.1]
/CATEGORIES VARIABLES= age_range4 region income_range3 expense_range4 ORDER=A KEY=VALUE EMPTY=INCLUDE
/CRITERIA CILEVEL=95.
| variable | Count | Column N % | |
| age_range4 | below 20 | 214 | 57.4% |
| 20-40 | 159 | 42.6% | |
| 40-60 | 39 | 10.5% | |
| above 60 | 127 | 34.0% | |
| region | Central China | 143 | 38.3% |
| East China | 64 | 17.2% | |
| North China | 62 | 16.6% | |
| Northeast China | 60 | 16.1% | |
| Northwest China | 62 | 16.6% | |
| Southwest China | 45 | 12.1% | |
| West China | 48 | 12.9% | |
| income per capita | Lowest thru 1999 | 57 | 15.3% |
| 2000-2999 | 39 | 10.5% | |
| 3000 thru Highest | 76 | 20.4% | |
| average expense per capita | Lowest thru 299 | 191 | 51.2% |
| 300-399 | 106 | 28.4% | |
| 400-499 | 152 | 40.8% | |
| 500 thru Highest | 144 | 38.6% | |
| gender | male | 71 | 19.0% |
| female | 6 | 1.6% | |
CTABLES
/VLABELS VARIABLES=gender age_range4 region income_range3 expense_range4 DISPLAY=LABEL
/TABLE age_range4> sat2 [S][MEAN F40.2] + region > sat2 [S][MEAN F40.2]+ income_range3 > sat2 [S][MEAN F40.2] + expense_range4 > sat2 [S][MEAN F40.2] by gender.
| satisfaction: hotel | gender | ||
| male | female | ||
| age_range4 | below 20 | 3.88 | 4.07 |
| 20-40 | 3.83 | 3.74 | |
| 40-60 | 3.71 | 3.85 | |
| above 60 | 3.51 | 3.41 | |
| region | Central China | 3.73 | 3.83 |
| East China | 3.68 | 3.43 | |
| North China | 3.77 | 4.17 | |
| Northeast China | 3.61 | 3.35 | |
| Northwest China | 3.92 | 3.74 | |
| Southwest China | 3.78 | 3.90 | |
| West China | 3.68 | 3.64 | |
| income per capita | Lowest thru 1999 | 3.92 | 3.79 |
| 2000-2999 | 3.55 | 3.75 | |
| 3000 thru Highest | 3.94 | 3.73 | |
| average expense per capita | Lowest thru 299 | 3.77 | 3.57 |
| 300-399 | 3.74 | 4.13 | |
| 400-499 | 3.61 | 3.45 | |
| 500 thru Highest | 4.00 | 5.00 | |
|
Function |
Description |
Default Label* |
Default Format |
|
COUNT |
Number of cases in each category. This is the default for categorical and multiple response variables. |
Count |
Count |
|
ROWPCT.COUNT |
Row percentage based on cell counts. Computed within subtable. |
Row % |
Percent |
|
COLPCT.COUNT |
Column percentage based on cell counts. Computed within subtable. |
Column % |
Percent |
|
TABLEPCT.COUNT |
Table percentage based on cell counts. |
Table % |
Percent |
|
SUBTABLEPCT.COUNT |
Subtable percentage based on cell counts. |
Subtable % |
Percent |
|
LAYERPCT.COUNT |
Layer percentage based on cell counts. Same as table percentage if no layers are defined. |
Layer % |
Percent |
|
LAYERROWPCT.COUNT |
Row percentage based on cell counts. Percentages sum to 100% across the entire row (that is, across subtables). |
Layer Row % |
Percent |
|
LAYERCOLPCT.COUNT |
Column percentage based on cell counts. Percentages sum to 100% across the entire column (that is, across subtables). |
Layer Column % |
Percent |
|
ROWPCT.VALIDN |
Row percentage based on valid count. |
Row Valid N % |
Percent |
|
COLPCT.VALIDN |
Column percentage based on valid count. |
Column Valid N % |
Percent |
|
TABLEPCT.VALIDN |
Table percentage based on valid count. |
Table Valid N % |
Percent |
|
SUBTABLEPCT.VALIDN |
Subtable percentage based on valid count. |
Subtable Valid N % |
Percent |
|
LAYERPCT.VALIDN |
Layer percentage based on valid count. |
Layer Valid N % |
Percent |
|
LAYERROWPCT.VALIDN |
Row percentage based on valid count. Percentages sum to 100% across the entire row. |
Layer Row Valid N % |
Percent |
|
LAYERCOLPCT.VALIDN |
Column percentage based on valid count. Percentages sum to 100% across the entire column. |
Layer Column Valid N % |
Percent |
|
ROWPCT.TOTALN |
Row percentage based on total count, including user-missing and system-missing values. |
Row Total N % |
Percent |
|
COLPCT.TOTALN |
Column percentage based on total count, including user-missing and system-missing values. |
Column Total N % |
Percent |
|
TABLEPCT.TOTALN |
Table percentage based on total count, including user-missing and system-missing values. |
Table Total N % |
Percent |
|
SUBTABLEPCT.TOTALN |
Subtable percentage based on total count, including user-missing and system-missing values. |
Subtable Total N % |
Percent |
|
LAYERPCT.TOTALN |
Layer percentage based on total count, including user-missing and system-missing values. |
Layer Total N % |
Percent |
|
LAYERROWPCT.TOTALN |
Row percentage based on total count, including user-missing and system-missing values. Percentages sum to 100% across the entire row. |
Layer Row Total N % |
Percent |
|
LAYERCOLPCT.TOTALN |
Column percentage based on total count, including user-missing and system-missing values. Percentages sum to 100% across the entire column. |
Layer Column Total N % |
Percent |
*This is the default on a U.S.-English system.
The.COUNTsuffix can be omitted from percentages that are based on cell counts. Thus,ROWPCTis equivalent toROWPCT.COUNT.
|
Function |
Description |
Default Label |
Default Format |
|
MAXIMUM |
Largest value. |
Maximum |
General |
|
MEAN |
Arithmetic mean. The default for scale variables. |
Mean |
General |
|
MEDIAN |
50th percentile. |
Median |
General |
|
MINIMUM |
Smallest value. |
Minimum |
General |
|
MISSING |
Count of missing values (both user-missing and system-missing). |
Missing |
General |
|
MODE |
Most frequent value. If there is a tie, the smallest value is shown. |
Mode |
General |
|
PTILE |
Percentile. Takes a numeric value between 0 and 100 as a required parameter. PTILE is computed the same way as APTILE in the TABLES command. Note that in the TABLES command, the default percentile method was HPTILE. |
Percentile ####.## |
General |
|
RANGE |
Difference between maximum and minimum values. |
Range |
General |
|
SEMEAN |
Standard error of the mean. |
Std Error of Mean |
General |
|
STDDEV |
Standard deviation. |
Std Deviation |
General |
|
SUM |
Sum of values. |
Sum |
General |
|
TOTALN |
Count of nonmissing, user-missing, and system-missing values. The count excludes valid values hidden via the CATEGORIES subcommand. |
Total N |
Count |
|
VALIDN |
Count of nonmissing values. |
Valid N |
Count |
|
VARIANCE |
Variance. |
Variance |
General |
|
ROWPCT.SUM |
Row percentage based on sums. |
Row Sum % |
Percent |
|
COLPCT.SUM |
Column percentage based on sums. |
Column Sum % |
Percent |
|
TABLEPCT.SUM |
Table percentage based on sums. |
Table Sum % |
Percent |
|
SUBTABLEPCT.SUM |
Subtable percentage based on sums. |
Subtable Sum % |
Percent |
|
LAYERPCT.SUM |
Layer percentage based on sums. |
Layer Sum % |
Percent |
|
LAYERROWPCT.SUM |
Row percentage based on sums. Percentages sum to 100% across the entire row. |
Layer Row Sum % |
Percent |
|
LAYERCOLPCT.SUM |
Column percentage based on sums. Percentages sum to 100% across the entire column. |
Layer Column Sum % |
Percent |
|
Function |
Description |
Default Label |
Default Format |
|
RESPONSES |
Count of responses. |
Responses |
Count |
|
ROWPCT.RESPONSES |
Row percentage based on responses. Total number of responses is the denominator. |
Row Responses % |
Percent |
|
COLPCT.RESPONSES |
Column percentage based on responses. Total number of responses is the denominator. |
Column Responses % |
Percent |
|
TABLEPCT.RESPONSES |
Table percentage based on responses. Total number of responses is the denominator. |
Table Responses % |
Percent |
|
SUBTABLEPCT.RESPONSES |
Subtable percentage based on responses. Total number of responses is the denominator. |
Subtable Responses % |
Percent |
|
LAYERPCT.RESPONSES |
Layer percentage based on responses. Total number of responses is the denominator. |
Layer Responses % |
Percent |
|
LAYERROWPCT.RESPONSES |
Row percentage based on responses. Total number of responses is the denominator. Percentages sum to 100% across the entire row (that is, across subtables). |
Layer Row Responses % |
Percent |
|
LAYERCOLPCT.RESPONSES |
Column percentage based on responses. Total number of responses is the denominator. Percentages sum to 100% across the entire column (that is, across subtables). |
Layer Column Responses % |
Percent |
|
ROWPCT.RESPONSES.COUNT |
Row percentage: Responses are the numerator, and total count is the denominator. |
Row Responses % (Base: Count) |
Percent |
|
COLPCT.RESPONSES.COUNT |
Column percentage: Responses are the numerator, and total count is the denominator. |
Column Responses % (Base: Count) |
Percent |
|
TABLEPCT.RESPONSES.COUNT |
Table percentage: Responses are the numerator, and total count is the denominator. |
Table Responses % (Base: Count) |
Percent |
|
SUBTABLEPCT.RESPONSES.COUNT |
Subtable percentage: Responses are the numerator, and total count is the denominator. |
Subtable Responses % (Base: Count) |
Percent |
|
LAYERPCT.RESPONSES.COUNT |
Layer percentage: Responses are the numerator, and total count is the denominator. |
Layer Responses % (Base: Count) |
Percent |
|
LAYERROWPCT.RESPONSES.COUNT |
Row percentage: Responses are the numerator, and total count is the denominator. Percentages sum to 100% across the entire row (that is, across subtables). |
Layer Row Responses % (Base: Count) |
Percent |
|
LAYERCOLPCT.RESPONSES.COUNT |
Column percentage: Responses are the numerator, and total count is the denominator. Percentages sum to 100% across the entire column (that is, across subtables). |
Layer Column Responses % (Base: Count) |
Percent |
|
ROWPCT.COUNT.RESPONSES |
Row percentage: Count is the numerator, and total responses are the denominator. |
Row Count % (Base: Responses) |
Percent |
|
COLPCT.COUNT.RESPONSES |
Column percentage: Count is the numerator, and total responses are the denominator. |
Column Count % (Base: Responses) |
Percent |
|
TABLEPCT.COUNT.RESPONSES |
Table percentage: Count is the numerator, and total responses are the denominator. |
Table Count % (Base: Responses) |
Percent |
|
SUBTABLEPCT.COUNT. RESPONSES |
Subtable percentage: Count is the numerator, and total responses are the denominator. |
Subtable Count % (Base: Responses) |
Percent |
|
LAYERPCT.COUNT. RESPONSES |
Layer percentage: Count is the numerator, and total responses are the denominator. |
Layer Count % (Base: Responses) |
Percent |
|
LAYERROWPCT.COUNT.RESPONSES |
Row percentage: Count is the numerator, and total responses are the denominator. Percentages sum to 100% across the entire row (that is, across subtables). |
Layer Row Count % (Base: Responses) |
Percent |
|
LAYERCOLPCT.COUNT.RESPONSES |
Row percentage: Count is the numerator, and total responses are the denominator. Percentages sum to 100% across the entire column (that is, across subtables). |
Layer Column Count % (Base: Responses) |
Percent |
- 文章信息
- 作者: kaiwu
- 点击数:431
- 文章信息
- 作者: kaiwu
- 点击数:450
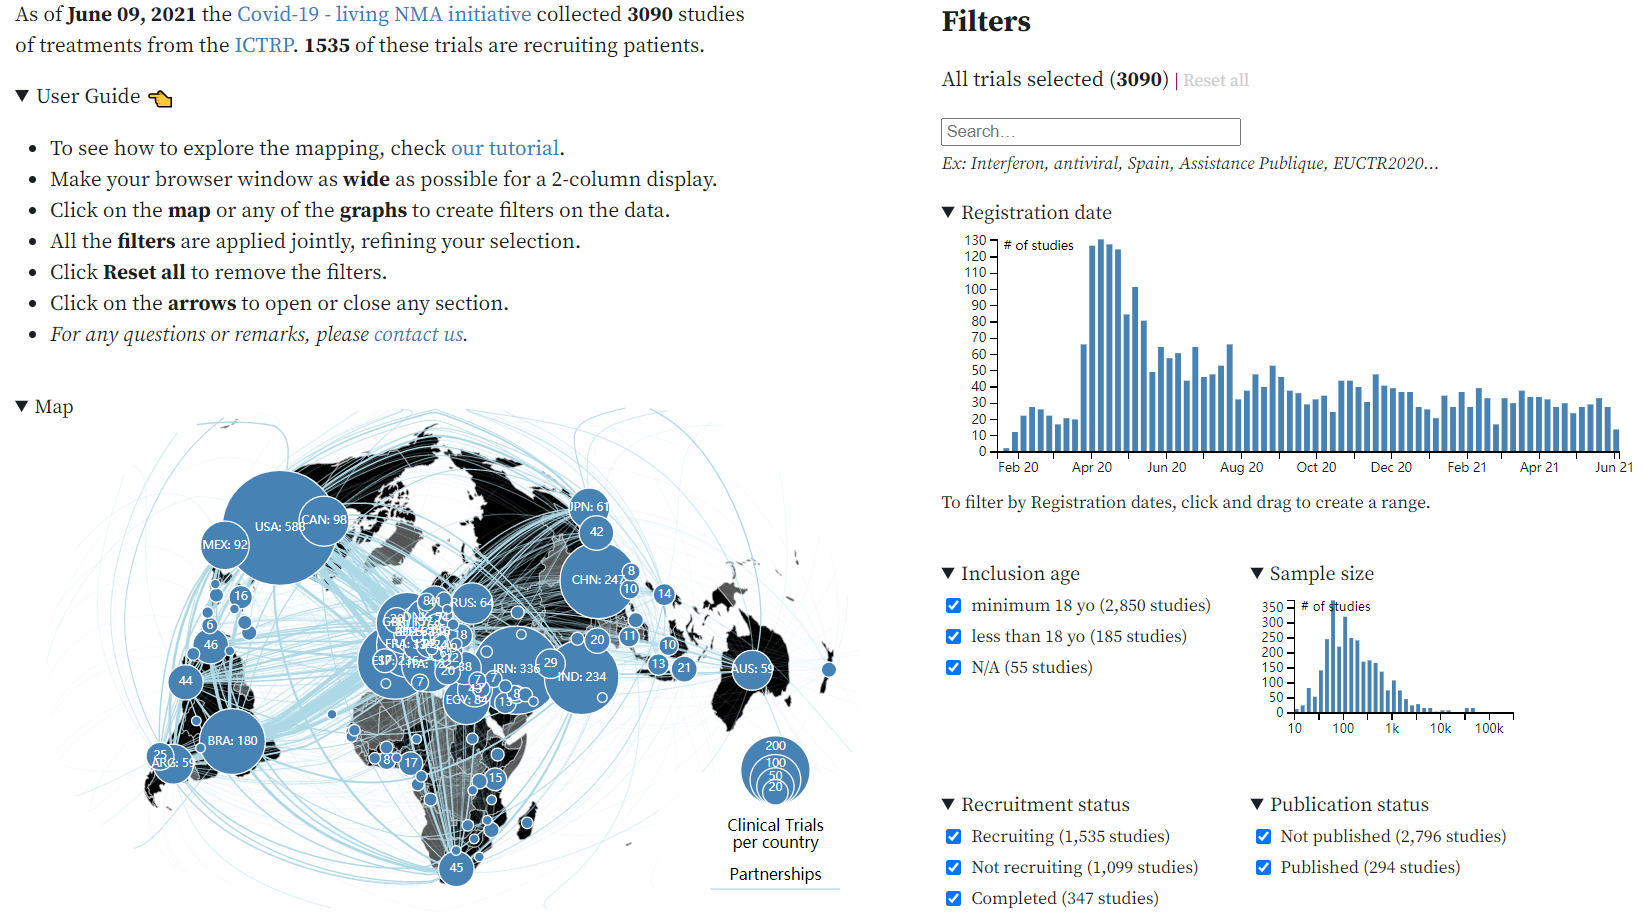
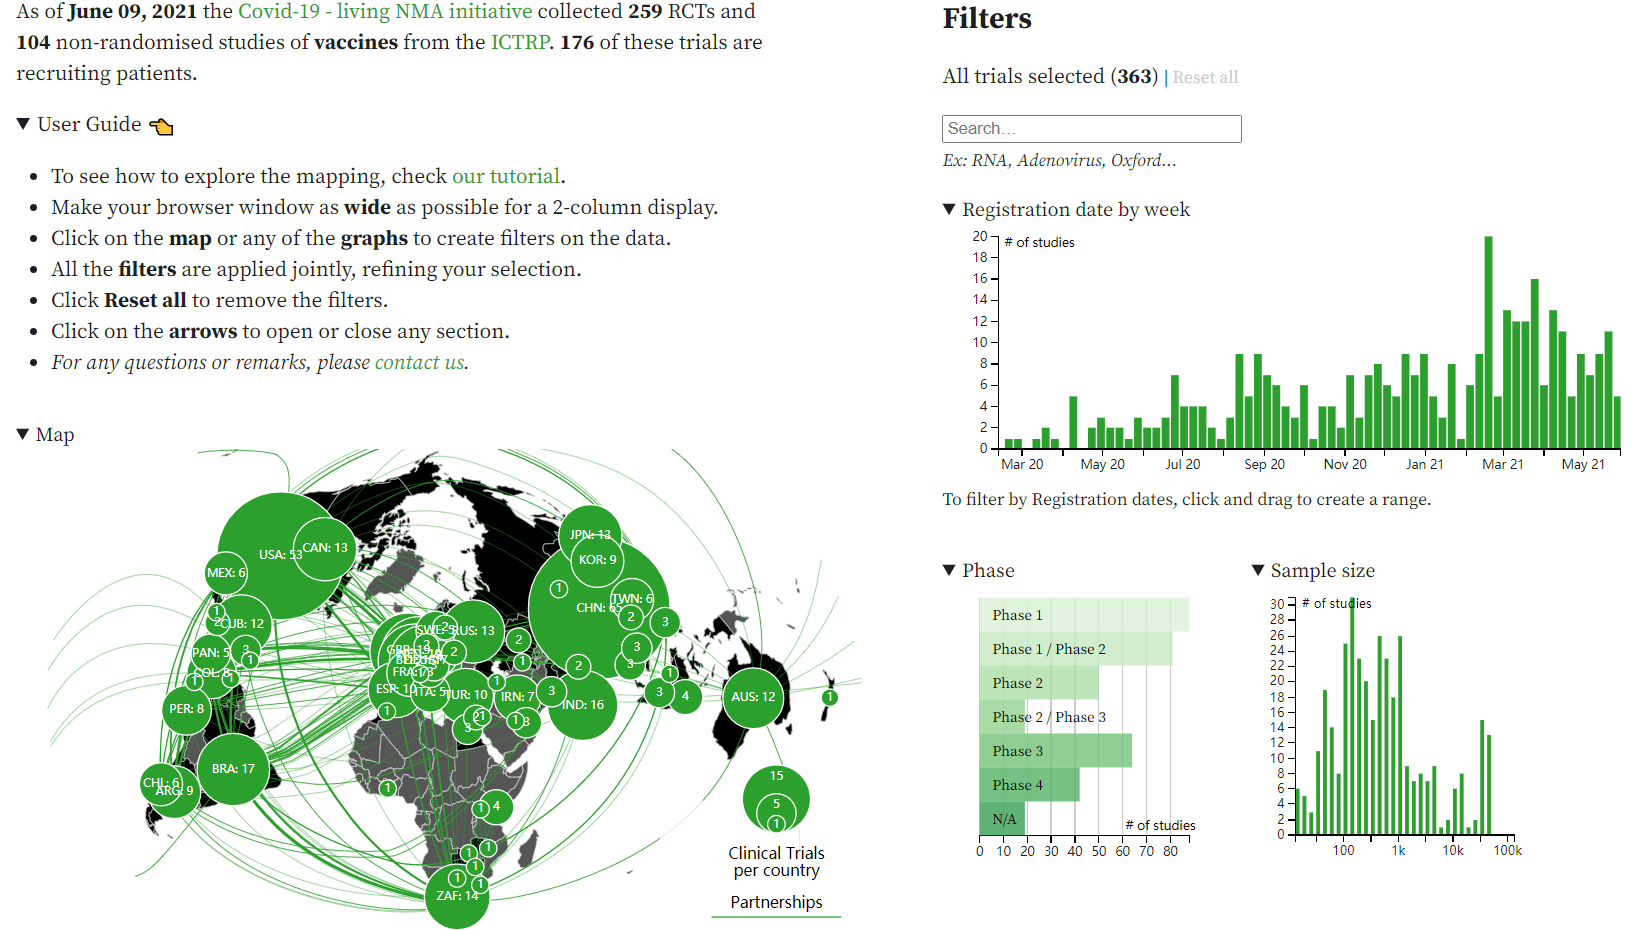
- Cite a dataset produced by the COVID-NMA initiative by using this format:
Thu Van Nguyen, Gabriel Ferrand, Sarah Cohen-Boulakia, Ruben Martinez, Philipp Kapp, Emmanuel Coquery, … for the COVID-NMA consortium. (2020). RCT studies on preventive measures and treatments for COVID-19 [Data set]. Zenodo. http://doi.org/10.5281/zenodo.4266528 - Cite a visualization developed by the COVID-NMA initiative by using this format:
Data: Thu Van Nguyen, Gabriel Ferrand, Sarah Cohen-Boulakia, Ruben Martinez, Philipp Kapp, Emmanuel Coquery, … for the COVID-NMA consortium. (2020). RCT studies on preventive measures and treatments for COVID-19 [Data set]. Zenodo. http://doi.org/10.5281/zenodo.4266528
Visualizations: Romain Vuillemot - LIRIS, École Centrale de Lyon; Philippe Rivière - LIRIS, VisionsCarto; Pierre Ripoll - LIRIS, INSA Lyon; Julien Barnier - Centre Max Weber, CNRS.
Retrieved from: ‘https://covid-nma.com/dataviz/’ [Online Resource]
https://covid-nma.com/dataviz/
https://covid-nma.com/vaccines/mapping/
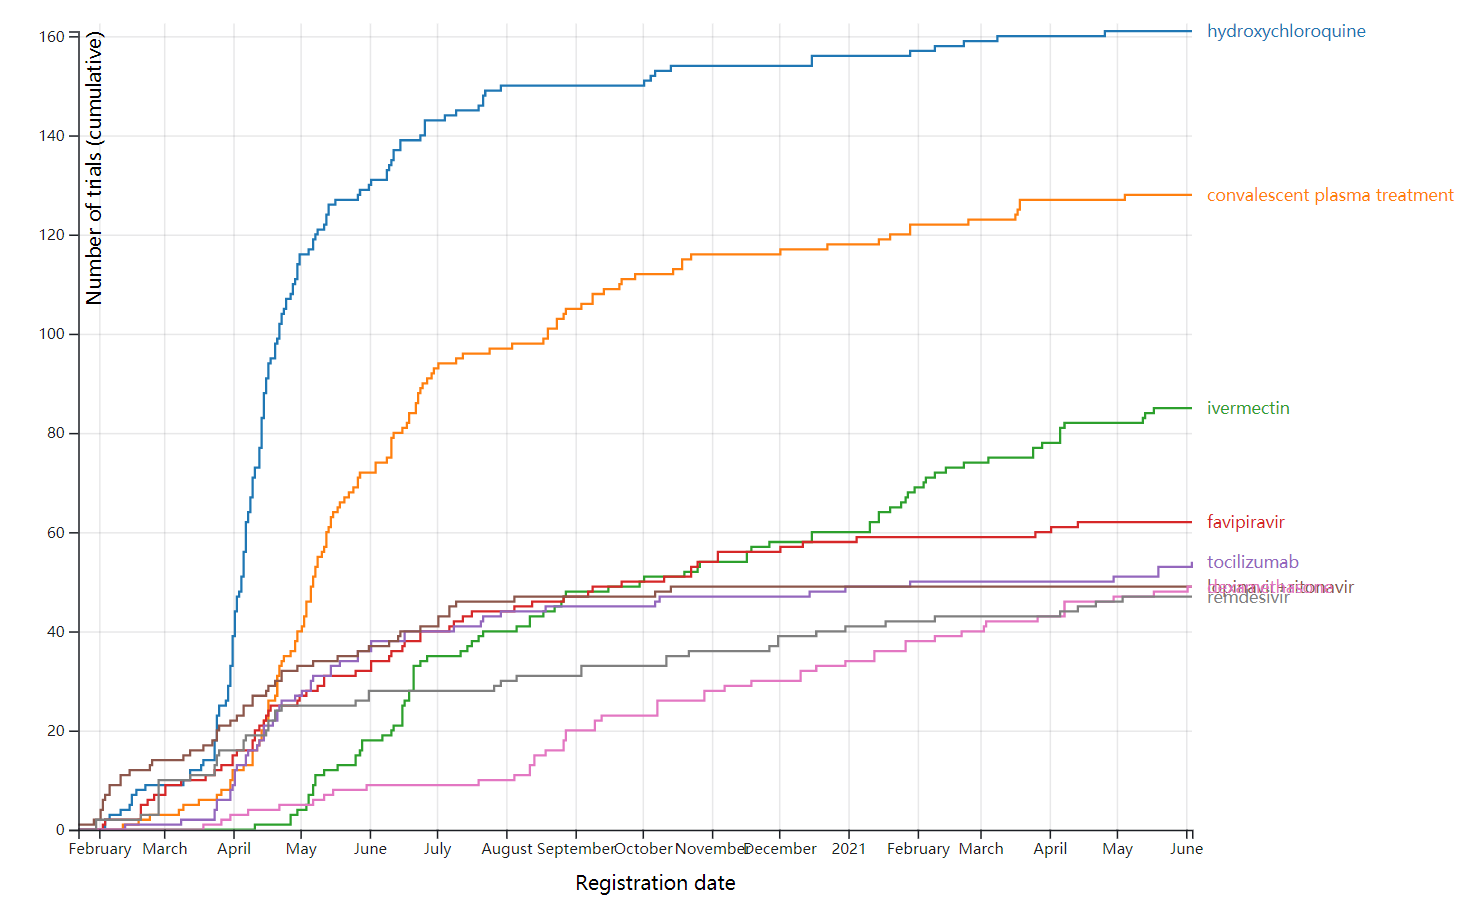
https://covid-nma.com/treatments_tested/
https://ncov.dxy.cn/ncovh5/view/pneumonia?from=timeline
https://www.healthmap.org/covid-19/
https://who.maps.arcgis.com/apps/opsdashboard/index.html#/c88e37cfc43b4ed3baf977d77e4a0667
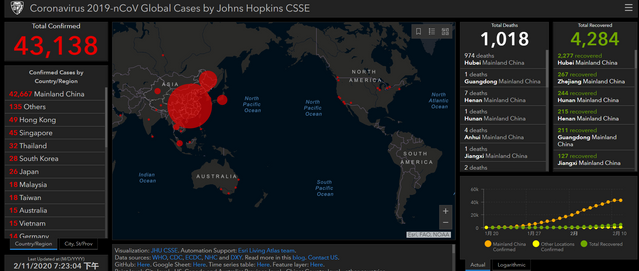
1.Johns Hopkins University
Johns Hopkins University
The Center for Systems Science and Engineering (CSSE) at Johns Hopkins University(JHU)
Visualization:JHU CSSE.
Automation Support:Esri Living Atlas team.
Read more in thisblog.
Data sources:WHO,CDC,ECDC, NHC andDXY.
Downloadable Google Sheet (new link):Here. Time series table:Here. Feature service:Here.
Point level: City level - US, Canada and Australia; Province level - China; Country level - other countries.
maps
https://gisanddata.maps.arcgis.com/apps/opsdashboard/index.html#/bda7594740fd40299423467b48e9ecf6
http://www.arcgis.com/apps/opsdashboard/index.html#/85320e2ea5424dfaaa75ae62e5c06e61
https://systems.jhu.edu/research/public-health/ncov-model-2/
2.Git hub
https://github.com/CSSEGISandData/COVID-19
https://github.com/search?q=ncov+2019(715)
https://github.com/shfshanyue/2019-ncov
https://github.com/BlankerL/DXY-COVID-19-Crawler
3.kaggle
The goal of this page is to bring together the most useful contributions from the Kaggle community's COVID-19 work into a single place. It is organized into literature review, tools and datasets.
https://www.kaggle.com/allen-institute-for-ai/CORD-19-research-challenge
https://www.kaggle.com/covid-19-contributions
https://www.kaggle.com/search?q=2019+ncov(257)
https://www.kaggle.com/paultimothymooney/coronavirus-genome-sequence/discussion/132982#latest-759834
https://www.kaggle.com/sudalairajkumar/novel-corona-virus-2019-dataset
4.tableau
https://public.tableau.com/zh-cn/search/all/ncov(161)
https://public.tableau.com/profile/dennis199441#!/vizhome/2019-nCoVMap/2019-nCoVMap
5.mathematica
https://community.wolfram.com/groups/-/m/t/1872608?source=frontpage-latest-news
- 文章信息
- 作者: kaiwu
- 点击数:788
Lingo是Linear Interaction and General Optimizer的缩写,中文名称为“交互式线性和通用优化求解器”,是由美国LINDO公司(1979年创立,总部位于美国芝加哥市)开发的一套运筹学(管理科学)软件包。Lingo可用于求解线性规划、二次规划、整数规划、非线性规划等问题。
![]()
官方网站:https://www.lindo.com/index.php/products/lingo-and-optimization-modeling
中文网站:http://www.lindochina.com/lg01.html
试用版下载网址:https://www.lindo.com/index.php/ls-downloads/try-lingo
最新版本:19.0
软件大小:40.3兆
教育版价格表:https://www.lindo.com/prices/EduPrices.pdf
商业版价格表:https://www.lindo.com/prices/CommercialPrices.pdf
公司发展历史:https://www.lindo.com/index.php/company/the-lindo-story
官方推荐书籍列表:https://www.lindo.com/index.php/help/recommended-books
|


1.Lindo System Inc. (2020). Lingo: The Modeling Language & Optimizer. Chicago, Illinois: Lindo System Inc.
http://www.lindochina.com/pic/PDF/LINGO.pdf
2.Schrage, L. (2006). Optimization Modeling with LINGO (6th). Chicago, Illinois: Lindo System Inc.
http://www.lindochina.com/pic/PDF/Optimization%20Modeling%20with%20LINGO%20by%20Linus%20Schrage.pdf
 http://www.lindochina.com/xzzx04.html
3.Tan, R. R., Aviso, K. B., Promentilla, M. A. B., Yu, K. D. S., & Santos, J. R. (2019). Input-Output Models for Sustainable Industrial Systems: Implementation Using LINGO. Singapore: Springer.
http://link.springer.com/10.1007/978-981-13-1873-3

4.Winston, W. L., & Goldberg, J. B. (2004). Operations Research: Applications and Algorithms (4th). Belmont, CA: Thomson Brooks.
https://www.amazon.com/dp/0534380581

温斯顿. (2004). 运筹学: 数学规划(英文影印版). 清华大学出版社.
https://book.douban.com/subject/1230287/
5.袁新生. (2007). LINGO和Excel在数学建模中的应用. 科学.
https://book.douban.com/subject/2023597/

6.谢金星, & 薛毅. (2005). 优化建模与LINDO/LINGO软件. 清华大学出版社.
https://book.douban.com/subject/1420357/
